
According to Google:
54.2% of all websites with CrUX data do not meet the excellent threshold for all three Core Web Vitals metrics – Largest Contentful Paint (LCP), Interaction to Next Paint (INP), and Cumulative Layout Shift (CLS).
However, passing the Core Web Vitals assessment is not an impossible task.
It involves a straightforward 3-step process:
- Run performance tests
- Identify Core Web Vitals issues
- Optimize them
By the end of this article, you will have all the knowledge you need to complete each step.
Quick Recap of Core Web Vitals
You might have come across this statement from Google:
“Optimizing for quality of user experience is key to the long-term success of any site on the web.”
As the famous saying goes, you can’t improve what you don’t measure.
Before the introduction of Core Web Vitals (CWV), measuring user experience was challenging.
In 2020, Google introduced Core Web Vitals to provide website owners with benchmarks that directly impact and signify the user experience. These metrics were part of Google’s broader initiative to emphasize user-centered metrics in evaluating overall web health.
At their core (pun intended), CWV are performance metrics that highlight the quality of user experience on a webpage. They focus on three main elements:
- Loading performance (LCP)
- Responsiveness (INP)
- Visual stability (CLS)
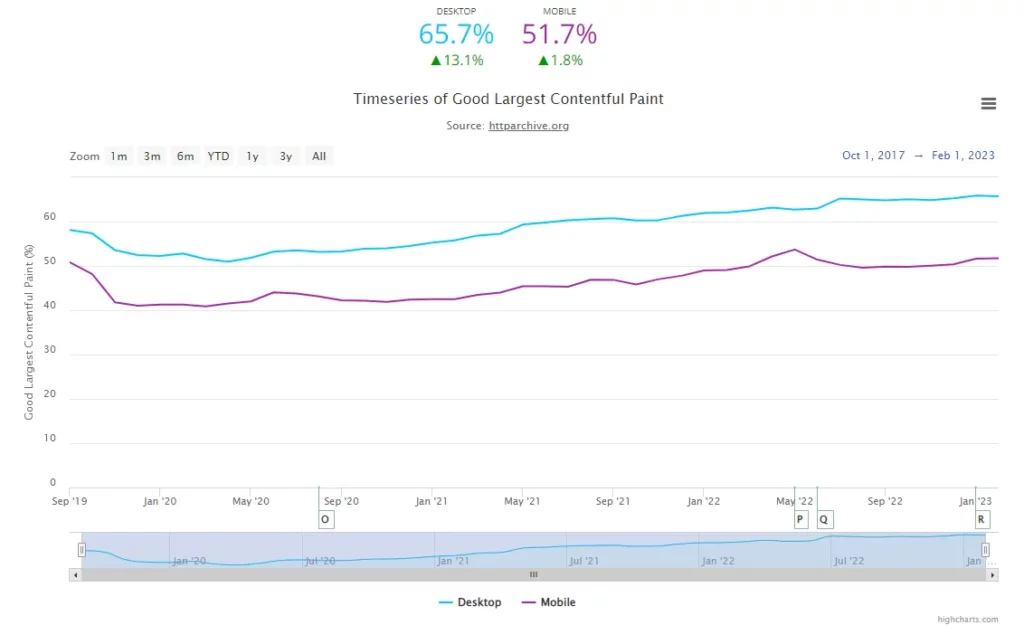
The Largest Contentful Paint (LCP) measures a page’s loading performance, specifically the time it takes for the main content to load. An optimal LCP is under 2.5 seconds.
Interaction to Next Paint (INP) measures the delay between a user’s input (such as clicking a link, tapping a button, or typing into a form field) and the visible response to that input on the screen. This includes the time it takes for the browser to process the event, execute any associated JavaScript, and render any changes to the page. A good INP score is below 200 milliseconds.
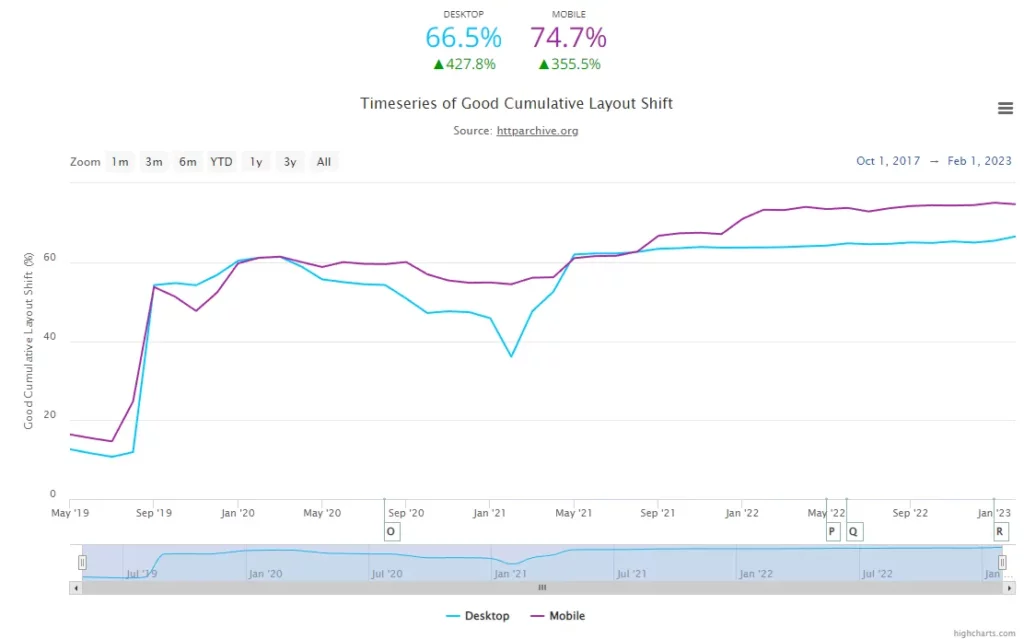
Cumulative Layout Shift (CLS) evaluates a page’s visual stability by examining unexpected layout shifts that occur without user input. A commendable CLS score is less than 0.1.
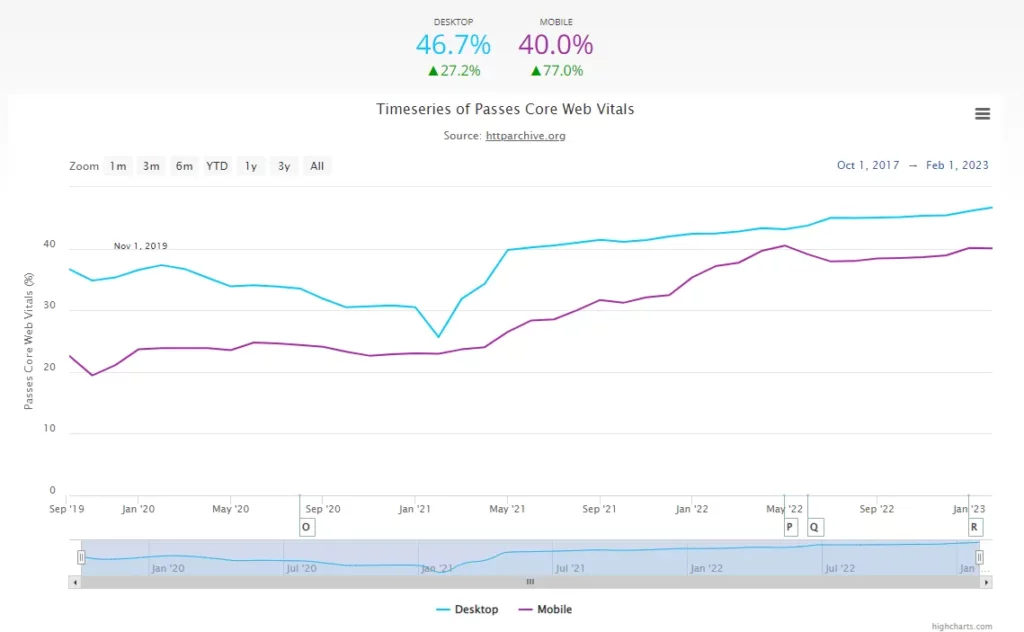
PERCENTAGE OF WEBSITE PASSING CWV
Core Web Vitals Thresholds
The Deprecation of FID
As of March 12, 2024, First Input Delay (FID) is no longer a Core Web Vital.
INP has replaced FID as it provides a more comprehensive way of assessing page responsiveness by measuring all interactions. In contrast, FID only accounted for the input delay of the first interaction.
What Does This Mean for You?
Chrome tools will no longer guarantee FID availability, and you have until September 9, 2024, to transition over to INP.
By understanding and optimizing for these metrics, you can significantly enhance the user experience on your site and ensure it meets Google’s performance standards.
Passing Core Web Vitals: The 75th Percentile.
When discussing Core Web Vitals metrics, Google often refers to the 75th percentile.
A site should aim for performance metrics that meet or exceed the recommended thresholds for at least 75% of its page visits.
This approach ensures that most user interactions with the site are satisfactory, rather than just focusing on average or median values.
How to Optimize Critical Requests for Faster Page Loads: 2024 Edition
Key Tools for Measuring Core Web Vitals
1. PageSpeed Insights
Google’s PageSpeed Insights provides both page-specific and origin-wide Core Web Vitals (CWV) data for the past 28 days. It also delivers actionable advice for boosting performance.
Due to its user-friendly interface, PageSpeed Insights is one of the most widely used performance tools. It offers a comprehensive report that includes your Core Web Vitals assessment based on field data and a performance score based on lab data.
The report also features Opportunities & Diagnostics widgets at the bottom, which provide a list of issues and the metrics they affect, helping you pinpoint areas for improvement.
2. Google Search Console
The Core Web Vitals report in Google Search Console includes performance data for individual URLs, making it an excellent tool for identifying specific pages that need improvement. Unlike PageSpeed Insights, Search Console provides historical performance data.
This allows you to track the impact of your optimizations over time and see if you are moving in the right direction.
3. Chrome User Experience Report (CrUX)
The Chrome User Experience Report (CrUX) collects real-world user experience data from countless websites, offering key insights on Core Web Vitals based on genuine user interactions.
You can access the CrUX dataset in two main ways:
- The Chrome UX Report API: Ideal for those familiar with JavaScript and JSON.
- BigQuery: Suited for those with a Google Cloud project and knowledge of SQL.
Most Common Core Web Vitals Issues in WordPress
A. Largest Contentful Paint (LCP) Issues
LCP measures the time it takes for the largest content element, such as an image or text block, to become visible on a webpage. Delays in loading this element can push the LCP metric into the unfavorable range. Here are the main culprits:
Slow Server Response Times Due to Budget Hosting
Slow server response times, often seen with shared hosting or overcrowded server environments, can significantly impact your LCP score. When server response times lag, the loading of LCP elements is delayed, creating a cascading effect of slow content rendering.
Render-Blocking JavaScript and CSS Introduced by Certain Themes and Plugins
Render-blocking resources are scripts and stylesheets that prevent a webpage from rendering until they’ve been fully processed. These resources can significantly delay the visibility of core content, affecting the LCP score.
- Theme and Plugin Impact: Many WordPress themes and plugins introduce elements that can obstruct rendering, delaying the visibility of core content and causing websites to fail their LCP assessment.
- Optimization Strategy: It is crucial to balance a site’s functionality with speed. Minimizing the use of unnecessary scripts and styles can help improve LCP.
Unoptimized Images
High-resolution images often have large file sizes. Without optimization, these files require more bandwidth, prolonging their download and rendering times.
- Prevalence: According to the Web Almanac, 72% of mobile and 82% of desktop pages have images as their LCP elements.
- Impact of Large Files: Bulky, unoptimized images increase download times and can introduce rendering challenges, particularly if browsers encounter image formats that require additional processing.
Dynamic Nature of WordPress: WordPress frequently fetches content from a database. If this database is hosted on a slow server, the retrieval and display of the content are delayed, affecting the loading time of the largest element on your page.
Time to First Byte (TTFB): Budget hosting can negatively affect TTFB, which measures the time it takes for the first byte of information to be sent from the server to the user’s browser. A prolonged TTFB often leads to a delayed LCP.
Resource Allocation: Shared hosting divides resources like CPU and RAM among multiple websites, meaning your WordPress site might only sometimes get the resources it needs for efficient loading.
How to Improve LCP on Your WordPress Site
- Upgrade Hosting: Consider using a higher-quality hosting provider with better server response times and dedicated resources.
- Optimize Server Performance: To improve server response times, use caching mechanisms, optimize your database, and consider using a Content Delivery Network (CDN).
- Minimize Render-Blocking Resources: Identify and defer non-essential JavaScript and CSS to improve render times.
- Optimize Images: Use modern image formats like WebP, compress images, and ensure they are properly sized for different devices.
B. Cumulative Layout Shift (CLS) Issues
A poor CLS score indicates that elements on a webpage unexpectedly shift, causing a frustrating user experience characterized by rage clicks and higher bounce rates. Here’s a detailed look at the primary causes behind these disruptive layout shifts:
1. Images Inserted Without Set Dimensions
One often overlooked aspect in web development is specifying image dimensions. Defining width and height attributes for images is critical to maintaining layout stability. Without these attributes, browsers cannot reserve the necessary space for images during the initial render. This oversight becomes consequential once the image fully loads. If its actual dimensions are larger than the assumed space, the image displaces nearby content, leading to sudden and disruptive layout shifts.
2. Ad Placements Without Reserved Space
Integrating dynamic elements like ads, videos, or embedded content presents challenges, particularly regarding the unpredictability of their dimensions. Failing to allocate space for these elements means the page renders without accounting for the space they will occupy. This issue becomes pronounced when these dynamic ads or videos load. If their size exceeds the default or unallocated space, they disrupt other content, causing noticeable layout shifts.
3. Unoptimized Font Delivery
Custom fonts are essential for maintaining brand consistency and enhancing visual appeal in web design. However, they introduce performance challenges such as FOIT (Flash of Invisible Text) and FOUT (Flash of Unstyled Text). These occur when custom fonts, especially large or externally sourced ones, take time to load and display. During this loading period, users may experience FOIT, where text remains invisible until the font fully loads, or FOUT, where a fallback system font is temporarily displayed before the custom font loads. Such sudden changes in text layout can disorient users who are reading or interacting with text elements.
C. Interaction to Next Paint (INP) Issues
Understanding Interaction to Next Paint (INP) Issues
A blocked main thread stands as a primary cause for poor Interaction to Next Paint (INP) scores. When the main thread is overwhelmed with queued tasks, user interactions must wait, leading to noticeable delays. Here’s an in-depth exploration of the key resources that commonly block the main thread:
1. Heavy JavaScript Execution
Heavy JavaScript execution significantly impacts INP on websites due to JavaScript’s single-threaded nature. When extensive JavaScript is processed, it monopolizes the main thread, responsible for critical tasks such as handling user inputs. Consequently, user interactions during heavy JavaScript execution experience delays.
Optimization Strategies:
- Minify and Compress JavaScript: Reduce file size to speed up execution.
- Defer or Async Attributes: Use
deferorasyncattributes to load non-critical JavaScript asynchronously, avoiding blocking of rendering. - Code Splitting: Break large JavaScript files into smaller, manageable parts for more efficient loading.
2. Poor Resource Prioritization
Not all website resources hold equal importance for initial rendering or user interactions. Improper prioritization can keep the main thread occupied with non-essential tasks, slowing down page responsiveness. Effective resource prioritization ensures critical resources are handled first, optimizing user experience and maintaining low INP scores.
Optimization Approaches:
- Critical CSS: Inline essential CSS to apply vital styles quickly.
- Preload Key Resources: Use
<link rel="preload">to prioritize loading essential assets. - Lazy Loading: Implement lazy loading for non-essential resources like images and iframes to defer their loading until needed.
3. Running Excessive Amounts of Third-Party Scripts
Third-party plugins and scripts, including analytics tools, advertising networks, and widgets, add processing tasks that impact page responsiveness. These scripts often require performance optimization to minimize extensive JavaScript execution or large data payloads. Moreover, their reliance on external servers can introduce latency issues.
Effective Management Strategies:
- Audit Third-Party Scripts: Regularly review and remove unnecessary scripts.
- Optimize Loading: Load third-party scripts asynchronously and defer non-critical scripts.
- Use Performance-Oriented Services: Choose third-party services known for optimizing performance to minimize impact on INP.
4. Having a Large DOM Size
The Document Object Model (DOM) forms the structural foundation of web pages, representing HTML documents as a tree structure. A large DOM increases the browser’s workload in rendering a page swiftly and efficiently, impacting responsiveness. Streamlining the DOM by focusing on essential elements is crucial for prompt response to user actions.
Optimization Techniques:
- Simplify DOM Structure: Remove unnecessary elements and reduce nested depth.
- Optimize Templates: Ensure clean templates without redundant elements.
- Lazy Load Off-Screen Elements: Load elements dynamically only when they are needed or visible within the viewport.
How to Fix Core Web Vitals Issues in WordPress (Checklist)
A. Optimizing Largest Contentful Paint (LCP)
LCP is often the most challenging metric to optimize, but these strategies can help significantly:
- Upgrade Your Hosting: Consider moving to dedicated or cloud hosting solutions to improve server response times, especially if you’re experiencing delays on shared hosting.
- Use a Content Delivery Network (CDN): Implementing a CDN ensures your site’s content is delivered quickly by caching it on servers closer to your users globally.
- Optimize Databases: Regularly clean up and optimize your WordPress database to remove unnecessary data, optimize queries, and use indexes effectively. Plugins like WP-Optimize can assist in this process.
- Choose the Right Image Format: Select appropriate image formats (e.g., JPEG for photos, PNG for transparent images, WebP for modern browsers) to balance quality and file size.
- Apply Compression: Use lossy and lossless compression techniques to reduce image file sizes without compromising visual quality.
- Resize Images: Deliver images in sizes optimized for different devices and viewports to prevent unnecessary resizing by the browser. Use tools or plugins like NitroPack for automatic resizing and optimization.
- Minify JS and CSS Files: Reduce the size of JavaScript and CSS files by eliminating unnecessary characters, whitespace, and code. Tools like Terser for JS and CSSNano for CSS can help with this process.
- Use defer or async Attributes: Optimize script loading using defer for non-critical scripts and async for scripts that can load independently without blocking rendering.
- Inline Critical CSS: Inline essential CSS directly within the HTML to immediately ensure styles crucial for above-the-fold content load.
B. Improving Interaction to Next Paint (INP)
Enhance page responsiveness with these optimizations aimed at reducing delays in user interactions:
- Use Web Workers: Offload complex computations to Web Workers to run JavaScript tasks in the background, freeing up the main thread.
- Prioritize Critical JS: Load essential JavaScript code first using rel=”preload” to ensure high-priority scripts are executed without delays.
- Reduce Unused CSS: Identify and remove unused CSS to minimize the amount of code that needs to be parsed and rendered, speeding up page loading.
- Break up Long Tasks: Split lengthy JavaScript tasks into smaller, asynchronous chunks using techniques like requestIdleCallback() to maintain responsiveness.
- Optimize Event Listeners: Consolidate event listeners by using event delegation on parent elements to reduce the number of active listeners and improve performance.
- Reduce DOM Size: Streamline the Document Object Model (DOM) by avoiding unnecessary DOM nodes and optimizing how elements are structured and styled.
- Avoid Recurring Timers: Minimize the use of setTimeout and setInterval functions to reduce input delay caused by JavaScript timers.
C. Reducing Cumulative Layout Shift (CLS)
Prevent unexpected layout shifts that disrupt user experience with these proactive measures:
- Define Dimensions for Elements: Always specify width and height attributes for images, ads, and embeds to ensure the browser reserves adequate space during page rendering.
- Use font-display: optional: Implement font-display: optional combined with <link rel=”preload”> for critical fonts to minimize layout shifts caused by font loading.
- Reserve Space for Dynamic Content: Allocate sufficient space in advance for dynamically loaded content like ads or iframes to prevent sudden layout adjustments when these elements load.
Conclusion:
While the journey to optimizing Core Web Vitals may seem daunting, the rewards are substantial. It’s not merely about complying with metrics but fundamentally enhancing how users interact with and perceive your website.
FAQs on Core Web Vitals:
What happens if my website doesn’t pass Core Web Vitals?
A website that fails to meet Core Web Vitals benchmarks may experience higher bounce rates and lower user engagement. This could negatively impact conversion rates and SEO rankings over time.
How often should I monitor Core Web Vitals?
It’s advisable to monitor Core Web Vitals regularly, especially after making optimizations or updating your website. Tools like Google PageSpeed Insights and Google Search Console provide insights into performance trends over time.
Can third-party scripts affect Core Web Vitals?
Yes, third-party scripts like ads, analytics, and widgets can impact Core Web Vitals metrics if not optimized. To minimize their impact, ensure these scripts load asynchronously and do not block critical rendering paths.
