After a new client is signed and you have all the information you need to begin working on their campaigns, most of your engagement with them will likely come through periodic client reporting.
There is no doubt that providing customers with actionable reports and insights is the greatest approach to show how your digital marketing agency contributes to their bottom line. However, the frequency and format of your reports may differ from client to client.
Reports to clients are essential to maintaining them in the long run. If done properly, they allow you to upsell your services to current customers by introducing them to new options.
The growth of your business might be stunted by falling into a few typical traps, such as devoting too much time to client reports.
What Is Client Reporting?
It’s the act of reporting on successes and failures in campaigns. Periodic client reports can be archived or provided in various media, including hard copy, electronic mail, presentation file, portable document format (PDF), and others.
Customers’ KPIs, such as website visits, social media following expansion, lead generation, revenue, brand awareness, market share, advertising budget, etc., form the basis for these strategic decisions.
You collect these numbers weekly, compile them into a report, and provide background for your customers.
So, the client reporting is the foundation for your conversation with the customer. It’s a chat that lets you both shine in your professions.
You are not limited to generating reports for your customers but may also make a dashboard just for them.
The most notable distinction is that dashboards feature real-time data, meaning they are constantly fresh, and clients will get up-to-the-minute data and results every time they log onto their dashboard.
Why Is Client Reporting Important in Business?
A report showcasing the success of a marketing campaign is guaranteed to make a client of a digital marketing agency very happy.
Yet, making charts and creating client reports after collecting this information can take time and effort. Even though it’s a major time and energy investment, it’s crucial to both your success and your client’s success.
Discovering your personal success formula will propel you to the top.
It’s the ideal approach to show your clients that their marketing budget was well spent and to strengthen your agency’s relationship with them.
Regular reporting to customers is a surefire method of retaining and attracting new ones to your organization.
Benefits of Client Reporting Tools

1. HELPS TRACK THE SUCCESS
Your client will be updated on their own and your achievements. Whether or not things are going swimmingly, reporting to clients is essential. When your clients have a prosperous month, they should since it proves you are doing an excellent job.
The result was a new contract with you or your agency for a similar campaign.
2. HELPS DETERMINE ACCOUNTABILITY
By maintaining a regular cadence of report sending, you and your customer will remain responsible to one another.
These reports are crafted with certain metrics and key performance indicators in mind, but how do you decide which ones are most important to monitor?
As a result of working together effectively, your customer will be more likely to give you realistic, attainable goals if you deliver a detailed report with clearly defined key performance indicators.
Besides helping you better meet your client’s needs, understanding their expectations may also be used to fine-tune your marketing efforts.
3. REDUCES CHURN AND IMPROVES RETENTION
Customer reporting helps keep more customers and lowers attrition. Client reporting is crucial for several reasons.
First, it demonstrates the worth of your services, facilitates two-way communication and openness, and fosters trust between your agency and your clientele.
Your firm may establish itself as a worthwhile investment by providing frequent updates to clients via insightful client reports and offering suggestions for how they might advance their business.
Customers that stop communicating with your agency often are a possible churn risk, so checking in with them over the phone when you sense a drop in communication is essential.
Moreover, it is common knowledge that attracting a new customer is more expensive than maintaining an existing one.
4. PROVIDE FRAMEWORK FOR REGULAR INTERACTION
If you’ve ever paid for a service and heard nothing in return, you know how frustrating it can be to wait for a response, even if the company is diligently working on your behalf.
Client reporting serves as a structure for consistent dialogue with clients. If you and your customer agree on a monthly or bimonthly reporting schedule in advance, you won’t have to worry about any miscommunications that might strain your relationship.
Customer reports, however, need not be self-contained, and they serve as a jumping-off point for fruitful in-person or online discussions concerning a client’s marketing performance.
In addition, some firms provide dashboards where clients may monitor progress toward goals in real-time.
5. EDUCATE YOUR CLIENTS
The fact that they sought you out as their marketing consultant suggests that many of your clientele need to be tech-savvy.
Although the client probably isn’t seeking a marketing lesson from you daily, the client report is the ideal location to inform the customer about the progress you’ve made and the outcomes you’ve obtained.
Reports to clients are an excellent medium for conveying information regarding the work you’ve done for them.
Often, people need help differentiating between key performance indicators (CTR, conversion rate, etc.) and may need help understanding their significance.
Yet your customer may get insight into the significance of each data point thanks to the KPI reports you to provide. Clients will feel more invested in the process as a whole if you take the time to educate them by sharing your knowledge.
Ultimately, this will help you meet their needs and exceed their expectations. One way to save time and effort is to utilize client reports to conduct fruitful conversations that enhance your entire strategy rather than relying on inefficient methods like phone calls and email threads.
6. MANAGE CLIENT EXPECTATIONS
It’s only sometimes the agency’s job to develop marketing strategies independently; the client’s perspective is often vital. In each report to the customer, you should detail the information you need from them in the upcoming reporting period and demonstrate how you’ve been living up to their expectations thus far.
7. UPSELL SERVICES
Client reports are an excellent tool for upselling customers when they make sense. Your ability to foresee your customers’ wants and provide them with new opportunities directly reflects your ability to use that data to provide beneficial and timely services.
Client reports are a great location to educate your client about the possible costs and advantages of exploring more marketing tactics.
They are also a great place to emphasize the costs and benefits of pursuing existing marketing techniques. Provide your SEO services and demonstrate how your client’s rivals are faring in organic search results, for instance.
Types Of Client Reports

1. Marketing Reports
Several different types of documents fall under the banner of marketing reports. Reports for SMM, SEO/SEM, PPC, organic traffic, and advertising campaigns are just a few examples of what may be generated.
The results of your marketing projects and activities may be communicated to clients through general marketing reports, which show how your work has improved upon key performance indicators.
You and the customer should agree on a set of key performance indicators and metrics to include in these reports.
Draw attention to how successfully you’ve been fulfilling these requirements and where you’ve run into roadblocks.
Clients should expect a monthly report that details the number of visitors to their site, the progress you’ve made toward their goals, and a breakdown of the effectiveness of your primary campaigns and channels.
An excellent strategy is to visually compare the results from the current month with those from the previous one using a graph.
Nevertheless, if the customer operates in a niche that has seasonal fluctuations, you may compare this month’s results to those of the corresponding month in the prior year.
2. Social Media Marketing Reports
Questions like how many new followers they’ve gained, how active their brand is on social media, and how their rivals fared in comparison to them are all key ones that should be addressed in reports on your clients’ social media presence.
The amount of likes and followers, the number of people who saw the post, and the percentage of people who interacted with it are all important data to track here.
In addition to looking at overall traffic and conversion rates, you should examine how your social media efforts are influencing sales.
Tracking tools for social media and Google Analytics provide all of this data.
3. SEO Report
Key phrases, inbound links, and organic search traffic are just a few of the metrics that should be included in any comprehensive SEO report.
The report should also highlight Returning Users and Pages per Visitor, both of which demonstrate how much time a visitor spends on each page and whether or not they return back for more.
Since that conversion is one of the key goals of SEO, metrics related to conversions, such as the registration to conversion ratio and CTR, are likely the most significant to emphasize here.
Your SEO report should typically include the following sections:
- Keyword Ranking
- Backlink Analysis
- Website Analysis
- Competitor Analysis
4. PPC or SEM Reports
Reports for pay-per-click and search engine optimization campaigns have the advantage of being easily quantified.
Conversions, costs, cost per click (the cost per lead), cost per conversion, and ad impressions are some of its more easily quantifiable measures (the number of people that saw the ad.)
5. Progress Update Reports
The status report is where you and the customer may discuss how things are going with the project. Provide a summary of the project, its progress, and the difficulties you’ve encountered and how you’ve overcome them.
These reports might serve as the basis for proposing additional deliverables or requesting a modification to the budget.
6. Research Reports
A research report is used to present the findings of a study conducted for a customer. Clients should be provided with actionable interpretations of the outcomes in these reports.
Top 5 Features every Agency Client Reporting Tool should Possess
Visualization of Data
Great client reporting software should make it simple to produce eye-catching images in various formats that effectively convey data trends.
Business analysis, evaluating user behavior, and measuring marketing effectiveness are all greatly aided by this.
Bar charts, line graphs, and color-coding may be used to display information in a marketing product effectively. Data visualization is helpful, but it has to be supported by content analysis to be truly effective.
With a bar chart, you may observe how much income grew from one quarter or one month to the next. A line graph may display information about sales and the number of clients.
Live, Adaptive, and Engaging Reports Dashboards
A dashboard is more than just a collection of graphs and charts. It’s a graphical representation of essential business KPIs and data.
Key performance indicators (KPIs) and their evolution should be easily understood and shared. This helps customers feel a feeling of urgency and establish priorities. As a result, customers may respond immediately.
Static Reports
Too many metrics are reported, a typical blunder made by agencies. They’re eager to display everything, yet need to be more careful with their stats.
This leads to an abundance of pointless reports being generated. They should instead concentrate on writing static reports.
A static report zeroes down on a topic to provide clients with the whole picture and divulges all relevant insights.
Create static reports that are simple to read and understand so agencies can effectively convey their messages to stakeholders.
Live Reporting
Real-time reporting becomes possible when data visualization and content analysis are used together. All information, including metrics imported from external applications, is shown in real-time.
Top Client Reporting ToolA
1. Megalytic
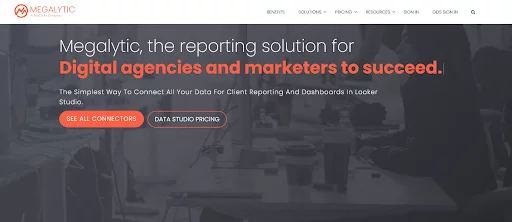
Digital advertising firms utilize Megalytic as a client reporting tool for keeping tabs on key performance indicators (KPIs) in their field. Megalytic’s reporting capabilities include the speedy automated distribution of marketing reports to various clients.
Megalytic’s ability to consolidate data from the several platforms used by an agency’s staff daily is a significant benefit. These platforms include Google Analytics, HubSpot, and other marketing management platforms.
Pros:
- Simple layout for making reports.
- Exceptional responsiveness to client needs and the ability to customize services to meet those needs.
- Ability to present facts in a way that is both visually appealing and easily digestible.
Cons:
- Little customization options and stodgy report widgets.
Pricing
Megalytic’s starting monthly price for a single user is $39.99, and that gets you ten connections and ten reports.
With the standard subscription, you get 30 reports and 50 connections for $99.99, while the premium plan with 50 reports and 100 connections, three users, and 10 customers costs $199.99.
The business plan costs $399.98 and includes 50 clients and 5 users, along with 100 reports and 200 connections. Megalytic offers a free 14-day trial period for all of its paid programs.
2. TapAnalytics
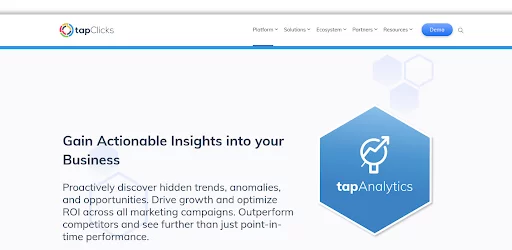
is an industry-leading marketing platform consolidating several traditionally separate analytics functions—including reporting, workflow management, and others—into a unified user experience.
Effortlessly save time and energy with its efficient reporting and marketing campaign analysis tools.
TapAnalytics automates data extraction from over a hundred sources and provides user-configurable widgets for displaying analytics to enhance advertising campaigns.
Pros:
- Its easy-to-use interface makes it available to everybody.
- Use a comprehensive library of integrations to meet all of your reporting requirements for advertising.
- Speed up data import with automated integration.
Cons:
- The lengthy turnaround time may be a deal breaker for certain organizations.
Pricing
Pricing for the TapClicks bundle starts at $599 or $499 monthly when paid annually. You may try it out for free for 14 days before being charged. This basic plan includes only email assistance and a limited set of integrations.
The Pro plan for medium-sized businesses has a beginning monthly price of $1499 or a yearly fee of $999. This package gives you access to all integrations and specialist support.
3. GrowthNirvana
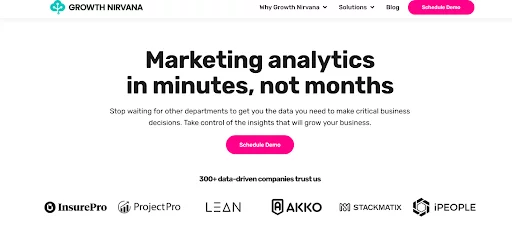
GrowthNirvana is an instant marketing analytics tool that requires no coding knowledge. To ensure that the data is saved and processed promptly and securely, the platform is highly controlled, encrypted, and accessible. Marketing analytics management is automated, and reports can be distributed widely.
Pros:
- Use friendly interface
- Customer Success team offers enterprise-level “white glove” assistance for onboarding and ongoing engagement
- More than 150 data connectors
- Links marketing channels to e-commerce or CRM systems for full-funnel analysis
Cons:
- One-person businesses cannot find a reasonable package.
Pricing
Starting at $1000/mo
4. Databox
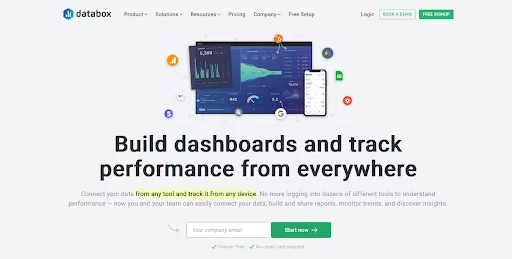
Databox helps firms engaged in digital marketing to monitor key performance indicators. Google Analytics, HubSpot, Facebook, Shopify, and more are just some of the services that may be connected to the platform through one of its more than 70 available connectors.
It compiles data from many dashboards to provide an all-encompassing picture of the marketing campaign’s performance.
Databox allows users to access and analyze their information from any mobile device, desktop computer, or laptop.
Owners of businesses may set goals and monitor their success with the help of this application thanks to its user-friendly interface and collection of pre-made templates.
Pros:
- The Interface is straightforward and offers several advantages, which is a major plus.
- Customers may learn the ropes with the help of the program’s free plan.
- Makes use of the information and metrics to set and monitor objectives.
- Updates and alerts may be sent directly to Slack and email.
Cons:
- Unsatisfactory personalization options and dashboards.
- The affordable options do not include white-label branding.
- Intermittent connection difficulties with many data sources, which might result in lost information or new data.
- Difficulty in creating custom reports due to the need for a separate spreadsheet to do the necessary calculations.
Pricing
Free accounts have access to more than 60 integrations and three data source connections and can be used indefinitely as a trial.
There are three tiers of paid subscriptions available, with prices ranging from $72 per month for very small teams up to $456 per month for very large teams. The number of desired connections determines the price for each tier.
5. RavenTools
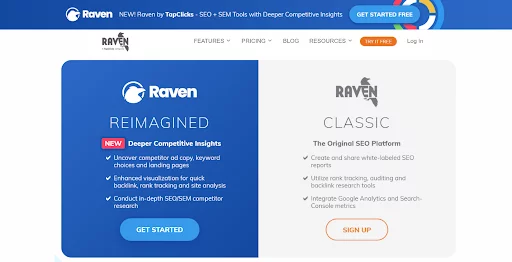
RavenTools is a fantastic agency tool because of its numerous useful capabilities. Search engine optimization (SEO), search engine marketing (SEM), pay-per-click (PPC), and social media content (SMC) may all be researched, managed, monitored, and reported on.
It also includes a site inspector and a backlinks explorer so that you can plan your social media posts. Thanks to a drag-and-drop capability, the report may easily have the study results.
Pros:
- The most read famous are included in white-label reports.
- Customer service is superb.
- User keyword ranks may be tracked with the help of the built-in keyword tracker.
Cons:
- Unable to personalize to client needs.
- The operating system lags in speed. Data generation can take time.
Pricing
While there is a free tier with certain limitations, the starter plan, ideal for young businesses, begins at $79 per month and goes up to $399 per month for large enterprises.
6. Whatagraph
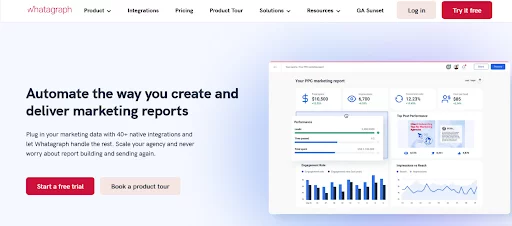
To monitor and evaluate the efficacy of a company’s marketing efforts, Whatagraph is an invaluable cross-channel reporting tool.
To assess whether a marketing campaign has succeeded, a digital marketing agency must monitor its return on investment (ROI).
Whatagraph generates impressive marketing reports in a matter of minutes. The whole thing is automated, and it pulls information from forty or more different sources. This means there is zero manual labor required.
Pros:
- For one, integrating data from many sources runs smoothly.
- There is a plethora of data collection and tool creation options.
- Widgets may be added and modified with little effort.
- The Whatagraph reports make it easy for customers to set and track KPIs and report on their progress every month.
Cons:
- The best plan for small enterprises is $319 per month, which may be too expensive for certain organizations.
Pricing
After a 7-day free trial, Whatagraph costs $139 per month for individual marketers and up to $779 monthly for large corporations. Customers can save up to 15% by paying for their subscription annually.
7. Klipfolio
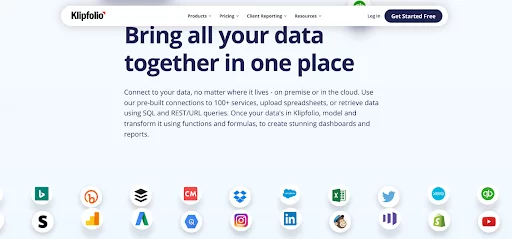
Klipfolio is a dashboard and analytics tool that presents your most critical real-time data on any device. It automatically tracks and discusses key performance indicators, allowing maximum convenience and adaptability.
Being a web-based program means that you can collaborate with people all around the world. Around ninety pre-made data and analytics, dashboards are available for customers to peruse and customize on the site.
Pros:
- Many data sources can be linked to and accessed by this instrument.
- Creating a dashboard and distributing it to your team is simple so everyone can see the data.
- Because of its “plug-and-play” design, virtually any integration is feasible without needing custom code.
Cons:
- The way they handle permits and responsibilities could be more user-friendly.
- Building and troubleshooting the APIs might be easier if you have prior technological skills.
Pricing
The free plan has limited features. Upon upgrading to the starter plan priced at $99 per month, users get additional features like 4 editor users, 4 data services, 5 dimensions, up to 1yr date range window, and 1hr data refresh.
It also has a pro plan priced at $229 per month. Kilpfolio also offers custom services, and users can contact them for pricing.
BEST PRACTICES FOR CLIENT REPORTING
1. Define general needs
Initially, you should think about the requirements of your target audience. If you want your reporting to be as effective and focused as possible, here is where you should start. For starters, you can ask them some pertinent questions like:
To begin:
- Describe your vision for the brand.
- What are we hoping to accomplish with this venture.
2. Kind of people you are hoping to attract
You should also learn how their firms function and what type of connection they wish to have in addition to asking these important questions.
Does it work better for them to receive monthly updates than being involved in every step of the analysis?
Taking care of these nitty-gritty tasks ahead of time will not only save time, but also demonstrate to the customer that they are important to you on a personable level.
3. Think of relevant KPIs and benchmarks
You should then consider metrics and key performance indicators (KPIs) that will help you keep tabs on progress toward meeting those demands.
Choose KPIs that are relevant to the type of project you are working on, whether it be search engine optimization, email marketing, social media, content production, or something else entirely.
It’s crucial to remember that KPIs should be defined in collaboration with customers so that everyone is on the same page about what’s being monitored.
Furthermore, setting goals for performance is an important stage in this process. This may be determined by comparing your company’s results to those of similar businesses.
If you keep track of your development this manner, you’ll have a benchmark to measure future success against. Just be sure that your expectations are reasonable. Too ambitious of goals set for the sake of client admiration might backfire.
4. Keep in mind your audience
While it is important to standardize both the reporting process and the dashboard-building process, it is also true that every client is unique and has their own individual metrics and requirements that must be addressed.
While working in a fast-paced workplace with many business cases every day, it is essential to have a clear vision of your audience and the information you wish to communicate.
Customers will remain loyal just as long as they see continuing value and their business continues to expand with your help.
For your custom client dashboards to be effective, you must first establish who you are writing for and what you want them to get out of it.
5. Simplify the process and focus on the context
In this case, the adage “less is more” rings true; this is one of the details that must be given careful consideration.
The dashboard will be simple to understand and the data will be crystal obvious if you keep the design minimal and mindful of your clients’ branding needs.
Including too many KPIs into a single dashboard will not help as much as focusing on the most critical measures and retaining a clean design.
Important business issues may be answered with the help of context and a thorough data story, both of which should be incorporated into the design.
6. Use interactive dashboard elements
Using interactive components like drill-downs, click-to-filter, or a time interval widget, among others, might help keep your dashboard from being too cluttered.
As a result, it won’t be cluttered with too many graphics, but users will still be able to dig deeper into the data if they so want.
The ability to interact with the data and apply various filters is crucial when compiling in-depth reports for customers.
Online data visualization solutions allow you to compile your findings in engaging visuals, streamline their creation using automation, and plan their dissemination to key stakeholders at your convenience. A chance like this is priceless for any company.
7. Utilize the right chart type
The proper use of the appropriate chart type is another essential habit you should adhere to.
If you need to display the connection between the data, the distribution, the composition, or a comparison, you may choose from a wide variety of charts, each of which has an optimal application and a straightforward premise.
Bubble charts, on the other hand, might be problematic since they involve too much mental work from users, whereas line charts are ideal for providing a comparison across a specified time period.
Think about what your charts will represent and what you hope to convey with your visualizations to get the most out of your time and work.
8. Tell a story
In creating authoritative reports, visuals are essential. In our previous two sections, we covered the value of implementing dynamic data visualizations.
Your audience will be more likely to grasp all the insights offered if you narrate an effective story using the facts.
Your material should be presented in such a way that the story it tells is as clear as possible, rather than as a series of charts and figures.
By doing so, they will feel more included in the procedure and misunderstandings will be avoided.
Some guidelines for creating a dashboard that tells a story are to keep it basic, to include words that explain certain metrics, and to arrange the data in a way that makes sense. Include just the most useful metrics, and avoid adding unnecessary complexity.
9. Automate the process
It’s a hassle for any business to have to spend time compiling reports. Agencies are no different from everyone else since they must manage several clients at once.
So, it is advisable to delegate the tough tasks to machines. Some commercially available web-based data analysis solutions provide automated functionality.
With only a few clicks, you can link the tool to your data sources and get timely reports created without lifting a finger.
Even the receivers and the medium through which the message should be delivered can be predetermined. In this way, you’ll be free to focus on developing effective methods.
10. Educate clients and be open to evolve
Finally, it’s important to inform your clientele and be flexible enough to adapt your methods as circumstances demand.
To help your clients better understand the data presented in your reports, take some time to run over a sample report with them.
This will allow for a more productive dialogue and an increased likelihood of collaboration by showing them the impact of your work.
Yet, your efforts are far from complete once the client dashboard is live and functioning. Any thriving business will undergo shifts, and those shifts should be reflected in your reports.
Learning how to analyze the data is an iterative process, and you and your audience may both benefit from each other’s insights.
Final Thoughts
Experts in advertising have never pretended that expanding a company’s reach would be simple. Building and maintaining a solid relationship with a client requires significant effort.
The most effective strategy for agencies is to use all the resources at their disposal.
With these methods, you may learn more about your clientele, boost their pleasure, and ultimately win their loyalty.

