

Picture this: you’re at a restaurant, starving, and the waiter brings you the menu, but it’s written in ancient hieroglyphics. By the time you decipher “burger,” you’re already contemplating cannibalism. That, my friends, is what a slow website feels like to your users.
Welcome to the world of website performance reporting! Today, we’re exploring how to transform boring numbers and cryptic metrics into a treasure map that leads to better user experiences.
So grab your compass, and let’s set sail on the sea of ‘how to use website performance reporting to improve UX’!
How To Use Website Performance Reporting to Improve UX?
Understanding Website Performance Reporting
Testing and evaluating a website’s performance concerning traffic, speed, SEO, and user insights is nothing but website performance reporting. It helps determine the adjustments you must make to enhance user experience (UX) and drive business growth.
In simpler terms, think of it like getting a health check-up for your website. You wouldn’t want to discover that your heart’s been running a marathon while you’re binge-watching Game of Thrones(it’s too late now!).
That last thing that you’d want is(you won’t) your website making your users work up a sweat just to load a page. Performance reports give you the lowdown on how fast, smooth, and stable your site is, which are crucial for keeping visitors happy and returning for more.
Key Performance Metrics:
Load Time (Page Speed): The time it takes for your site to fully display its contents on your device screen. Faster loading times equal lower bounce rates and ensure higher user satisfaction.
Time to Interactive (TTI): It takes your site to become fully interactive. A shorter TTI ensures users can engage with your site sooner.
First Contentful Paint (FCP): FCP is the actual time it takes for the very first piece of content to popup. It influences users’ perception of how fast your site is loading. The less, the better.
Cumulative Layout Shift (CLS): Measures unexpected layout shifts that can disrupt user interaction, such as when elements move unexpectedly as the page loads.
Largest Contentful Paint (LCP): The time it takes for the largest content element (e.g., an image or video) to load. It indicates when the main content is visible to users.
Tools for Website Performance Reporting
Below are some of the popular Website performance reporting and measuring tools that you can incorporate into your workflow for better results:
Google Analytics: Provides comprehensive insights into user behavior and site performance.

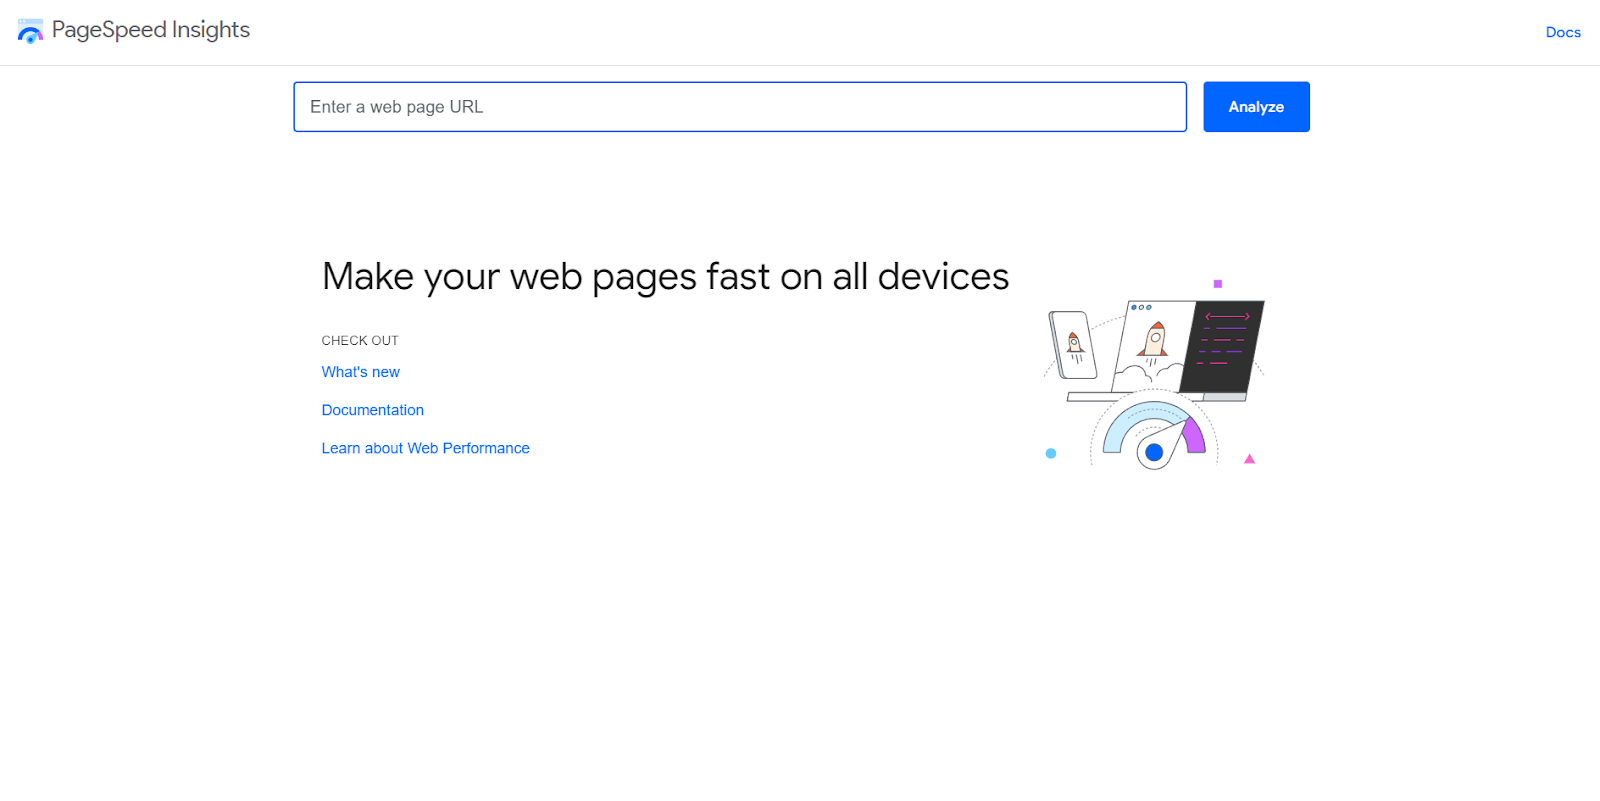
Google PageSpeed Insights: Analyzes your site’s speed performance and provides optimization suggestions.
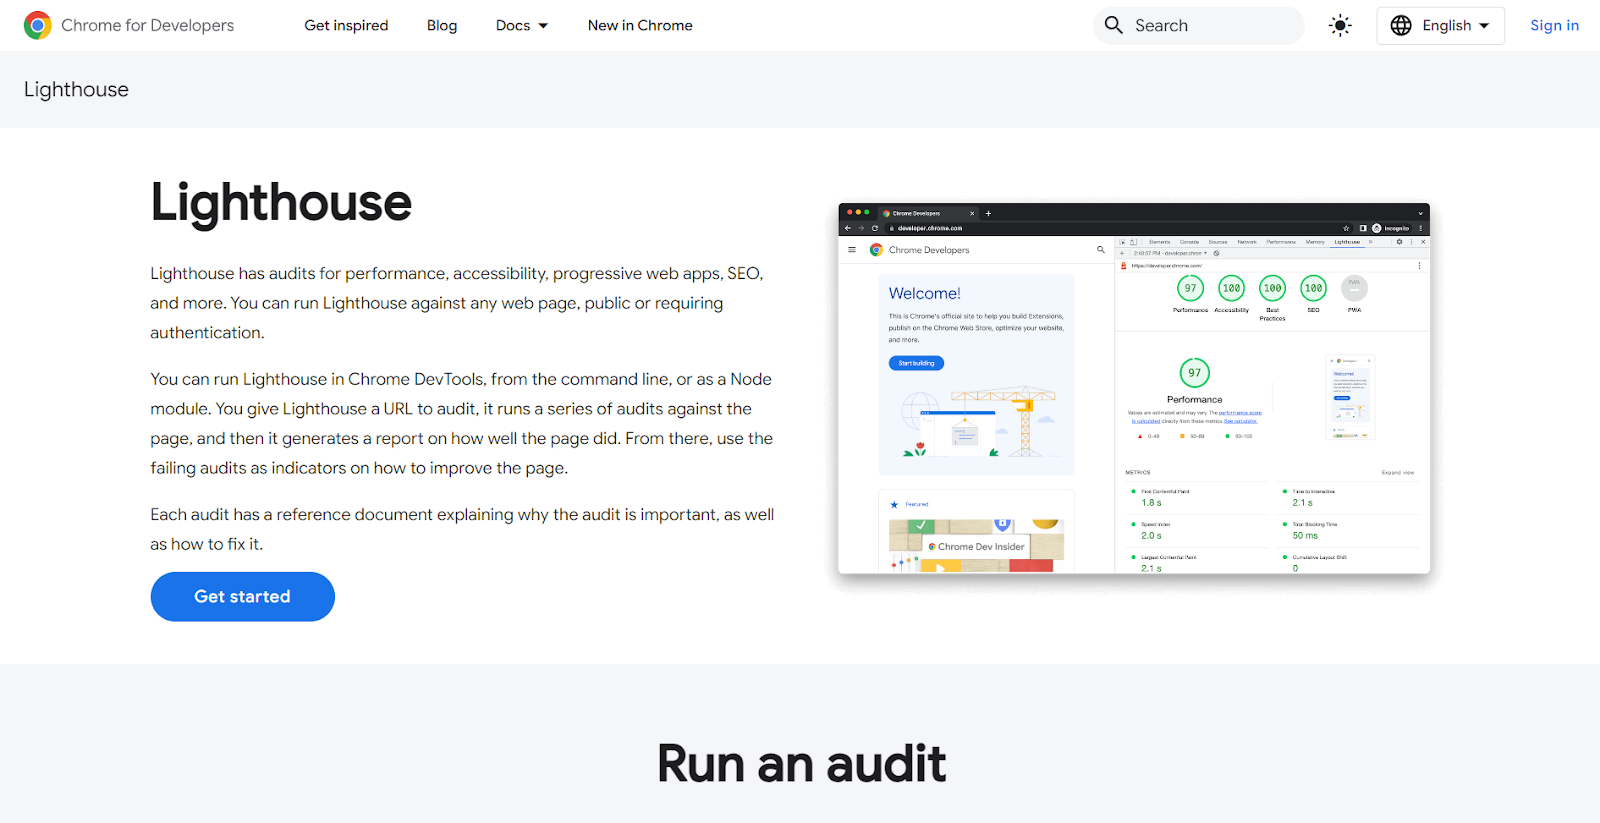
Lighthouse: Google’s Lighthouse is an open-source tool that audits web page quality and provides performance metrics.
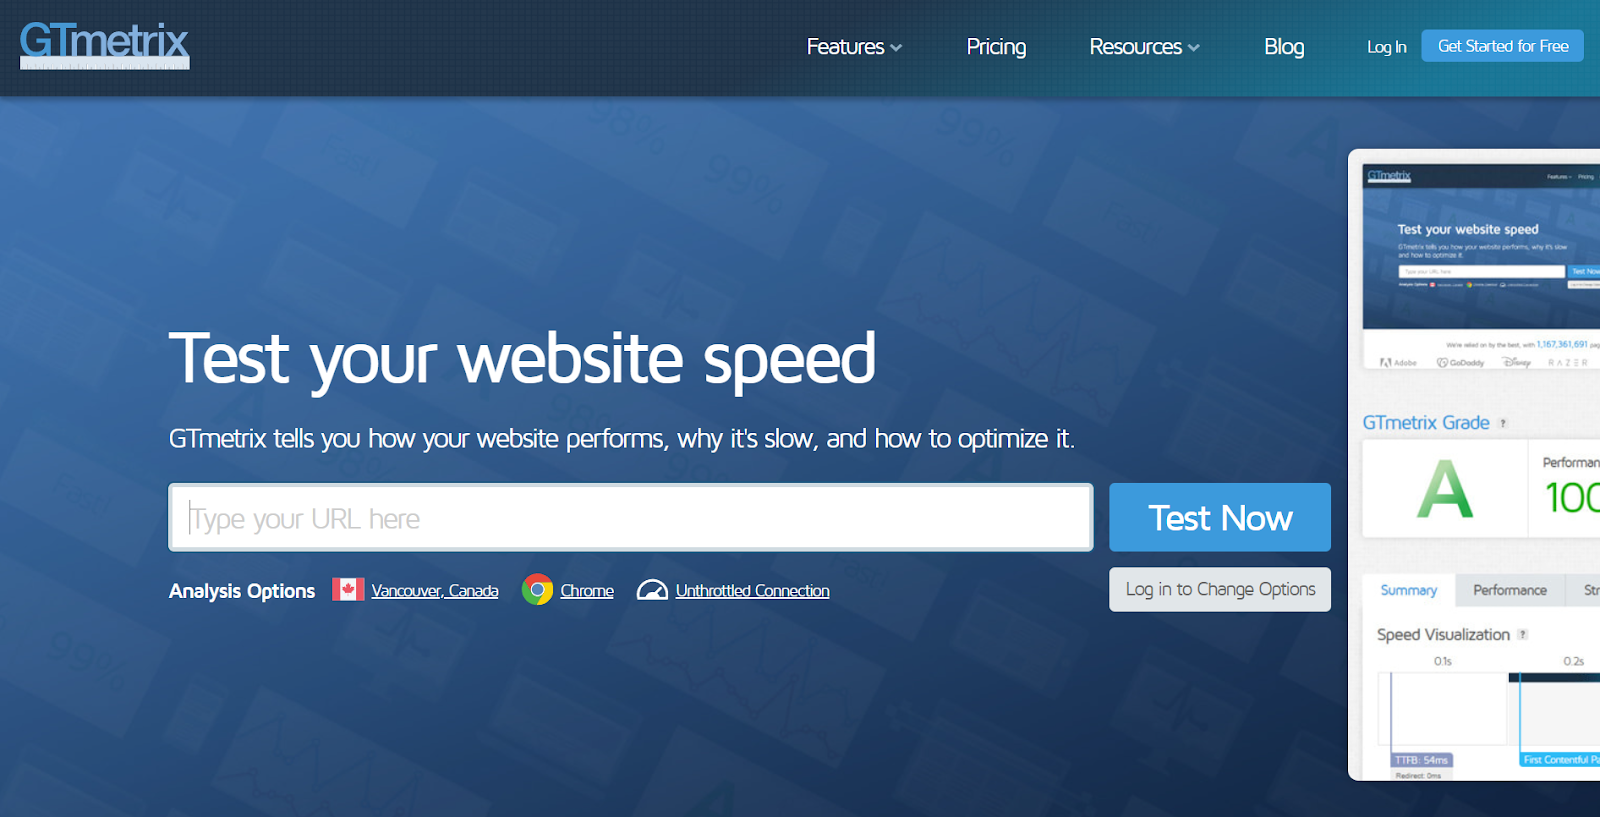
GTmetrix: Offers detailed performance reports and recommendations for improving site speed.
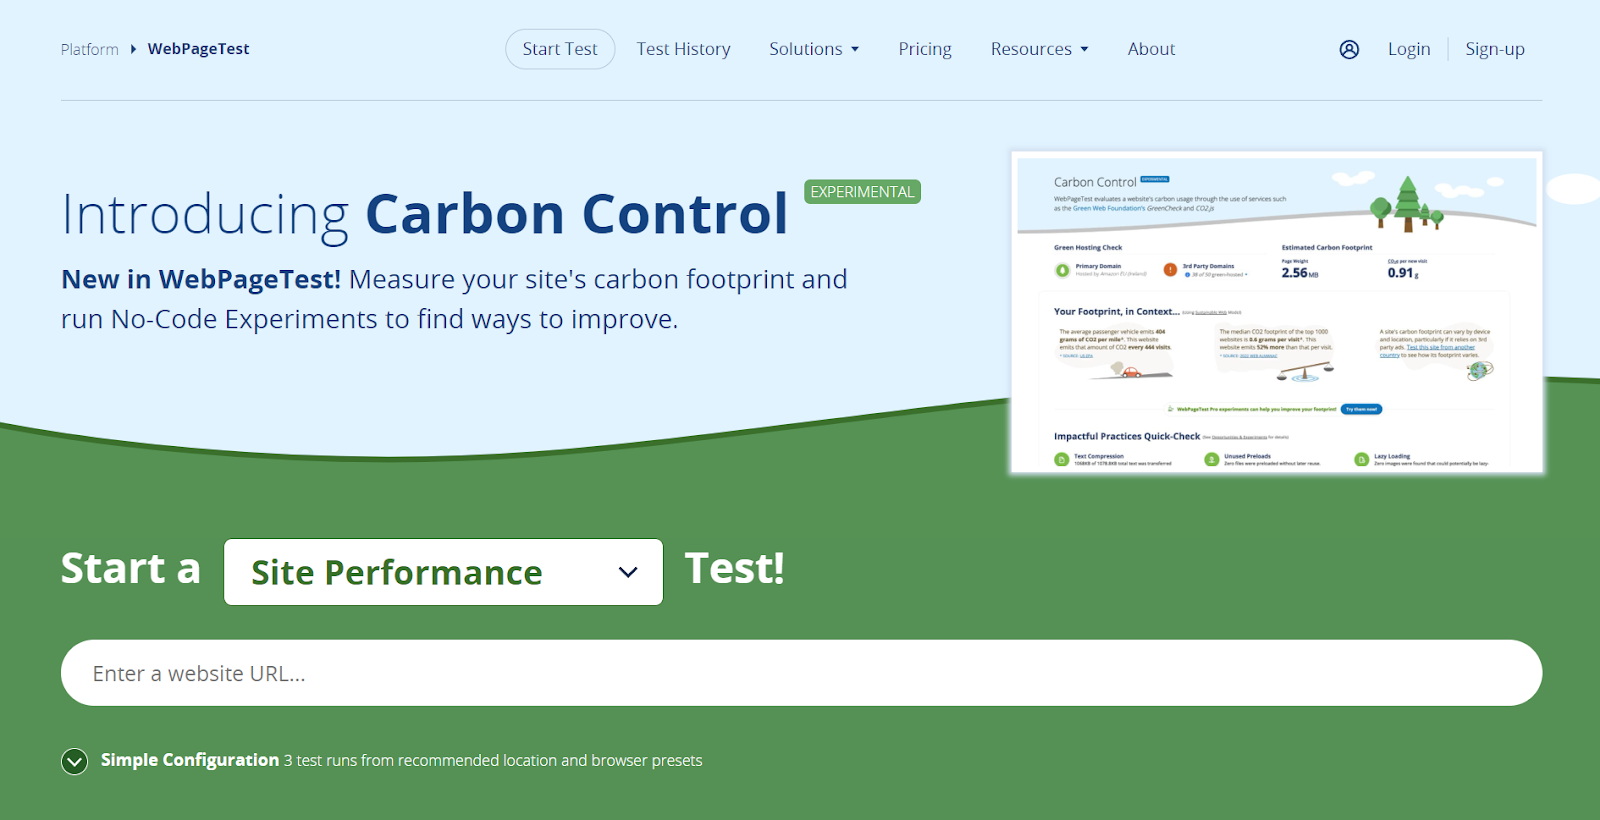
WebPageTest: Provides detailed performance testing from multiple locations and devices, helping you understand global user experiences.
Analyzing The ‘Website Performance Reporting’ Reports

Gathering Data:
So, how do you collect all the juicy data? It’s like going on a safari – only you’re hunting for slow scripts and heavy images instead of lions and zebras. Use your tools to run tests regularly and gather data, which, when viewed over time, makes it easier to spot trends.
Identifying Patterns and Trends:
Look for patterns. Is your site slower on Mondays? Does the load time spike every time you post a cat video? Identifying these trends can help you pinpoint what’s dragging you down. The more you look, the more you’ll find! And the more you’ll find, the more you’ll fix it!
Understanding User Impact:
Here’s where you get to play psychologist. How do these metrics translate into user feelings? Slow load times lead to frustration. High CLS means users might start an impromptu game of “click the button before it moves again.” By taking into consideration these impacts, you can prioritize fixes that will make the biggest difference.
Common Performance Issues and Their Impact on UX
Slow Loading Times:
This one’s a no-brainer. A slow site is like being stuck behind a grandma with a walker in a 100-meter dash. Users are impatient – if your site’s dragging its feet, they’ll hop on to your competitor’s website given that it is faster than yours or yours is unbearably slow. Modern times demand modern speeds, and modern speeds mean being fast!
Unstable Page Elements (CLS):
Remember that game where you try to click a button, but it keeps moving? It’s not fun. Unstable elements not only annoy users but can also lead to accidental clicks. If a certain page is being abandoned frequently, you must check for Unstable Page Elements on that specific page. It can be a pure nightmare if your CTAs are unstable. This can significantly hinder your sales or sign-ups.
Delayed Interactivity (TTI):
Have you ever tried to click on something only to have your computer ignore you like a moody teenager? That’s delayed interactivity. The longer users wait to interact, the more likely they are to leave or vent their frustration on social media. And we don’t want that. So make sure everything is as zappy and shiny as it looks.
Implementing Changes and Measuring Impact
Below are a few actionable steps that can help you:
Prioritize Fixes: Data on website efficiency enables you to locate bottlenecks that might be causing your website to lag. Excessive JavaScript, big-picture files, and slow server response times are common problems. By fixing these problems, you can greatly enhance the user experience on your website, which will also improve the load times and general performance.
Implement Improvements: Apply strategies like image optimization and code minification to address identified issues. Address one issue at a time to avoid overwhelming yourself. Over time, things resolve themselves.
Monitor Results: Track performance metrics post-implementation to measure improvements and identify further opportunities for optimization. You can compare current performance metrics with baseline data obtained before making changes. This comparison helps quantify improvements and validate the effectiveness of implemented strategies.
Monitoring Progress:
Regularly review performance reports and user feedback to ensure ongoing improvements and responsiveness to changing user expectations. Pay attention to user feedback regarding site speed and usability. The key here is to utilize surveys, heatmaps, and session recordings to gain some valuable insights into how users actually interact with your site and perceive its performance.
Suggested read:
Conclusion: Website Performance Reporting To Improve UX
Making sure every note on your website sings and resonates precisely with your audience is similar to fine-tuning a musical instrument to improve user experience (UX) through website performance reporting. By thoroughly examining your website’s performance data, you may find hidden obstacles, improve navigation, and ensure that your website meets and eventually exceeds user expectations.
A combination of creative intuition and analytical rigor is essential for this. Accept the insights in your performance reports, and keep testing, improving, and making adjustments to give your users a smooth, entertaining, and engaging experience. Never forget that a well-functioning website is the foundation of a positive user experience.
FAQs: Website Performance Reporting To Improve UX
How often should I review my website performance reports?
Regular reviews are essential. Monthly reviews can be a good starting point depending on your site’s traffic and activity. However, if you’re running campaigns or experiencing issues, more frequent monitoring may be necessary to respond swiftly to any problems.
Can website performance affect SEO?
Absolutely! Search engines like Google totally consider website performance in their ranking algorithms. Sites that load faster and provide a better user experience are more likely to rank much higher in search results. This makes performance optimization not just a UX priority but also an SEO strategy.
How do I identify performance issues from the reports?
Look for patterns in the data that suggest problems. High bounce rates, long load times, and frequent error messages indicate issues. Comparing these metrics against industry benchmarks or your historical data can help pinpoint specific areas that need improvement.
