
Debugging is often the unsung hero of the software development process. While writing code may grab the spotlight, it’s the debugging tools that ensure the software runs smoothly.
Studies reveal that developers spend a significant portion of their time fixing bugs, with estimates ranging from 50% to 75%. In fact, according to a survey by the National Software Development Association, 71% of developers report spending more than half of their time on bug fixing and troubleshooting, rather than writing new code. These bugs can vary from simple syntax errors to complex logical flaws, and if left unresolved, they can lead to critical system failures, lost productivity, and frustrated users.
This is where the right debugging tools in software testing are crucial. In this article, we’ll explore why debugging is so vital to successful software development, supported by real-world statistics, and introduce the best debugging tools that can help developers work more efficiently.
Mastering these tools can cut down the time spent on debugging by up to 40%, improve code quality, and lead to faster development cycles. By leveraging the right debugging tools, you can resolve issues more quickly, avoid critical errors, and build more reliable software, ultimately enhancing productivity and reducing costs.
What is Debugging in Programming?
| Statistic | Value | Source |
|---|---|---|
| Percentage of time developers spend on debugging | 50-75% | Bugs in Software Development: An Empirical Study |
| Percentage of software defects caused by undetected bugs | 60% | 2018 State of the Software Engineering Report, GitHub |
| Average cost of fixing a bug during the design phase | $1 | IBM’s “Cost of a Defect” Study |
| Average cost of fixing a bug during the maintenance phase | $100 | IBM’s “Cost of a Defect” Study |
| Percentage of bugs caught by automated testing | 90% | 2019 State of Testing Report, PractiTest |
| Percentage of bugs that occur in the coding phase | 35-40% | The Software Engineering Body of Knowledge (SWEBOK) |
| Percentage of bugs found after deployment | 25% | Google’s Testing on the Toilet |
| Time to debug one line of code (on average) | 30 minutes | Microsoft Research on Debugging |
At its core, debugging is a fundamental task in the software development process. It begins once developers write the initial code and start testing it to ensure it behaves as expected. The primary goal of debugging is to identify any discrepancies between the program’s intended functionality and its actual performance. By pinpointing these issues, developers can resolve errors and make sure the software meets its specified requirements.
Whether you’re working on a small app or a complex enterprise system, debugging is essential for preserving the integrity of the program. Without a well-organized debugging approach, even the most meticulously written code can lead to unexpected behavior, introduce security vulnerabilities, or fail altogether.
Choosing the right debugging tool for the task, along with understanding and resolving the specifics of different programming languages, is key to effectively tackling these challenges.
Learn about top frontend monitoring tools here for enhanced functionality and security.
The Challenges of Debugging: Navigating the Roadblocks with the Best Debugging Tools
1. Complexity of Code
As software projects grow, they typically involve more intricate layers of code, dependencies, and third-party libraries or APIs, which increases the chances of encountering bugs. Modern applications often rely on external tools, libraries, or systems that add complexity. Debugging code across multiple technologies requires developers to understand not only their own code but also the interactions and behaviors of these external dependencies.
The more complex and expansive the codebase, the more challenging it becomes to isolate the root cause of an issue. To navigate this complexity, developers need to rely on robust software debugging tools that allow them to efficiently trace and manage errors across interconnected components and external systems.
2. Unpredictable Bugs
Bugs can be erratic and tough to predict. While simple issues like syntax errors or typos are relatively easy to catch, more complicated problems, such as those related to multi-threading or race conditions, are harder to identify. These unpredictable bugs may only appear under specific conditions, making them challenging to reproduce and debug.
To address these elusive issues, developers need production debugging tools that offer advanced capabilities, such as breakpoints, memory profiling, and multi-threading support. These tools enable developers to identify and track complex bugs that may not be consistently reproducible, providing deeper insights into system behavior.
3. Time Constraints and Pressure
In the fast-paced environment of software development, time is often a critical factor. Developers are under constant pressure to meet deadlines, deliver high-quality software quickly, and fix issues in real-time. This can lead to shortcuts or missed bugs that accumulate and compromise the overall quality of the software and code execution.
Maintaining a balance between speed and quality is a key challenge. Developers must prioritize efficient debugging to ensure that software stability and performance are not compromised. Access to the debugging tools that help streamline the debugging process, enabling developers to quickly identify and fix issues without sacrificing software quality or productivity.
Exploring Two Key Approaches to Debugging: Reactive vs. Proactive
When it comes to debugging, developers typically rely on one of two fundamental approaches: reactive debugging or preemptive debugging. Each method has its own unique benefits, challenges, and ideal use cases, but they share a common goal—ensuring the code is bug-free and functions as expected. Let’s break down each approach to understand when and how they are used in the debugging process.
- Reactive Debugging: Responding to Bugs After They Surface
Reactive debugging is exactly what it sounds like—debugging after the bug has been detected. This approach is often employed when an issue is reported, or a bug surfaces during the testing phase, and the developer has to respond accordingly. The primary characteristic of reactive debugging is that it involves finding and addressing problems in real-time, as they appear.
A common example of reactive debugging is using print statements or console logs to output the values of variables or the flow of the program. This technique helps developers track the execution of code, identify where things go wrong, and pinpoint problematic areas.
For instance, if a program unexpectedly crashes, a developer may insert print statements throughout the code to check which variable’s value is incorrect or if a certain function isn’t being called as expected. While effective for quick fixes, reactive debugging can be time-consuming, especially when dealing with complex or intermittent bugs. In addition, this approach only comes into play after the issue has already occurred, meaning that bugs can potentially cause disruptions before they’re identified and resolved.
While reactive debugging is essential in many scenarios, it’s a “fix-it-later” approach that can be inefficient for large codebases or complex systems. The more reactive you are, the more you may find yourself in a cycle of hunting down bugs as they emerge—rather than preventing them altogether.
- Preemptive Debugging: Catching Bugs Before They Happen
In contrast, preemptive debugging takes a more proactive stance. Rather than waiting for bugs to appear and then reacting to them, preemptive debugging focuses on preventing problems before they ever surface—or at least catching them early, before they cause significant disruption.
This approach involves integrating preventive measures into the code that allow developers to detect and resolve issues more efficiently. One of the most common techniques in preemptive debugging is logging. By adding logging mechanisms into key parts of the application, developers can track the system’s behavior during execution, including variable states, user actions, and function calls.
If something goes wrong, the logs provide valuable insights that help identify the root cause quickly. Logs can also be configured to capture performance data, error messages, or warnings that might indicate potential issues before they evolve into full-fledged bugs.
Preemptive debugging might involve adding extra code to facilitate these checks, but the best practices ensure that this additional code does not interfere with the core functionality of the application. The goal is to create a safety net that allows for early detection without negatively impacting the user experience or system performance.
This approach can drastically reduce the time spent hunting down bugs after they’ve appeared. With robust preemptive debugging practices in place, developers may not even need to reproduce the bug on their local machines to fix it—often, the logs and diagnostic tools provide enough information to resolve the issue remotely. Additionally, preemptive debugging can help developers identify patterns in bugs, track recurring issues, and refine the code to prevent similar problems in the future.
Maximize Your Code Quality with the Best Debugging Tools in Software Testing: Top Picks
1. LT Debug from LambdaTest
LambdaTest is a cloud-based test orchestration platform designed to support both manual and automated testing across more than 3000 real browsers, devices, and operating systems at scale. LT Debug is a standout tool from LambdaTest, designed to simplify and enhance the debugging experience for developers.
It’s particularly useful for debugging web applications, offering a wide array of features that allow developers to troubleshoot issues quickly without complex setups or configurations.
Installation and Setup
LT Debug is a free tool, and installation is quick and straightforward. To get started, simply visit the LT Debug Chrome Extension page and add it to your browser. Once installed, you can start using the tool immediately, eliminating the need for complex setup procedures.
Pros:
- Ease of Use: No complex setup required, and it integrates easily with the browser.
- Real-Time Debugging: Real-time CSS and JavaScript injection, header manipulation, and more make it very versatile.
- Free Tool: LT Debug is entirely free to use.
Cons:
- Limited to Chrome: As a Chrome extension, it’s only available for developers using Google Chrome.
- Browser-Specific Features: Some of its features may not be useful for debugging server-side or non-browser-based issues.
Why LT Debug Stands Out
LT Debug is celebrated for its simple interface, powerful feature set, and minimal setup time. It gives developers an efficient way to troubleshoot issues across multiple browsers and platforms without needing additional tools.
2. Airbrake
Airbrake is a cloud-based error and bug-reporting solution designed to streamline the debugging process. It offers powerful error-tracking capabilities, real-time monitoring, and integrations with popular development tools, making it an essential tool for businesses that want to ensure high reliability and performance in their applications.
Pros:
- Real-Time Monitoring: Continuous error tracking with instant notifications.
- Easy Integration: Seamlessly integrates with other development tools like Slack and GitHub.
- Powerful Grouping and Analysis: Automatically groups similar errors and tracks error trends over time.
Cons:
- Limited Support for Non-Web Applications: Airbrake is mostly tailored for web applications, so its features may not be ideal for desktop or mobile apps.
- Pricing: While it offers powerful features, the pricing model may be too expensive for smaller teams or businesses with lower budgets.
Why Airbrake Is Ideal for Developers
Airbrake is a powerful error-tracking tool that helps developers manage bugs and performance issues with ease. It’s particularly beneficial for teams needing real-time error detection and detailed reporting for web applications.
Learn about top HTTP requests here.
3. Chrome DevTools
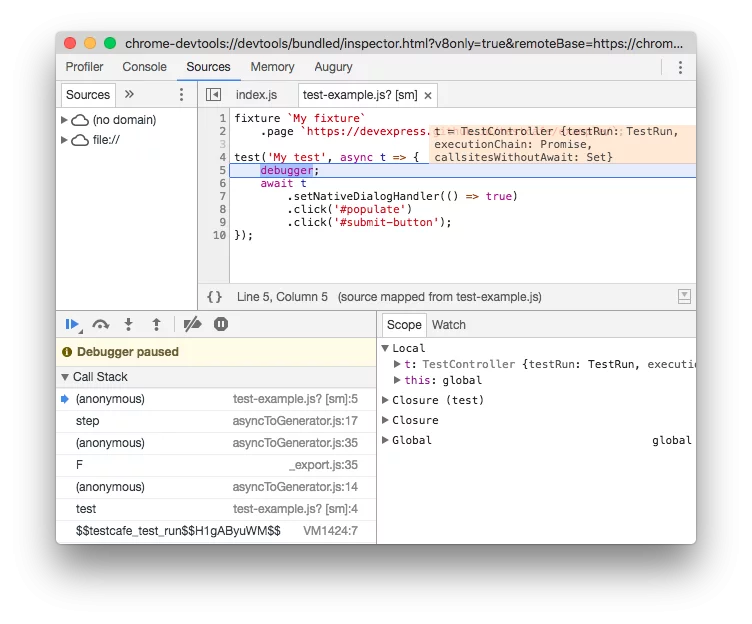
Chrome DevTools is one of the most widely used debugging tools for web developers. It’s integrated directly into Google Chrome, offering a range of features that help developers debug HTML, CSS, JavaScript, and optimize their website performance.
Pros:
- Comprehensive Debugging Tools: Extensive features for debugging HTML, CSS, JavaScript, and network performance.
- Real-Time Interaction: Real-time code changes and performance profiling.
- Free and Built-In: As part of Google Chrome, it’s free and easily accessible.
Cons:
- Limited to Chrome: While Chrome DevTools is a powerful tool, it’s only available for developers working with the Chrome browser.
- Can Be Overwhelming for Beginners: The wide array of features and panels may be overwhelming for new developers.
Why Chrome DevTools is Essential for Web Developers
Chrome DevTools is an indispensable tool for developers working with web technologies. It provides everything needed for real-time debugging, performance optimization, and ensuring that your web applications run smoothly.
4. ReSharper
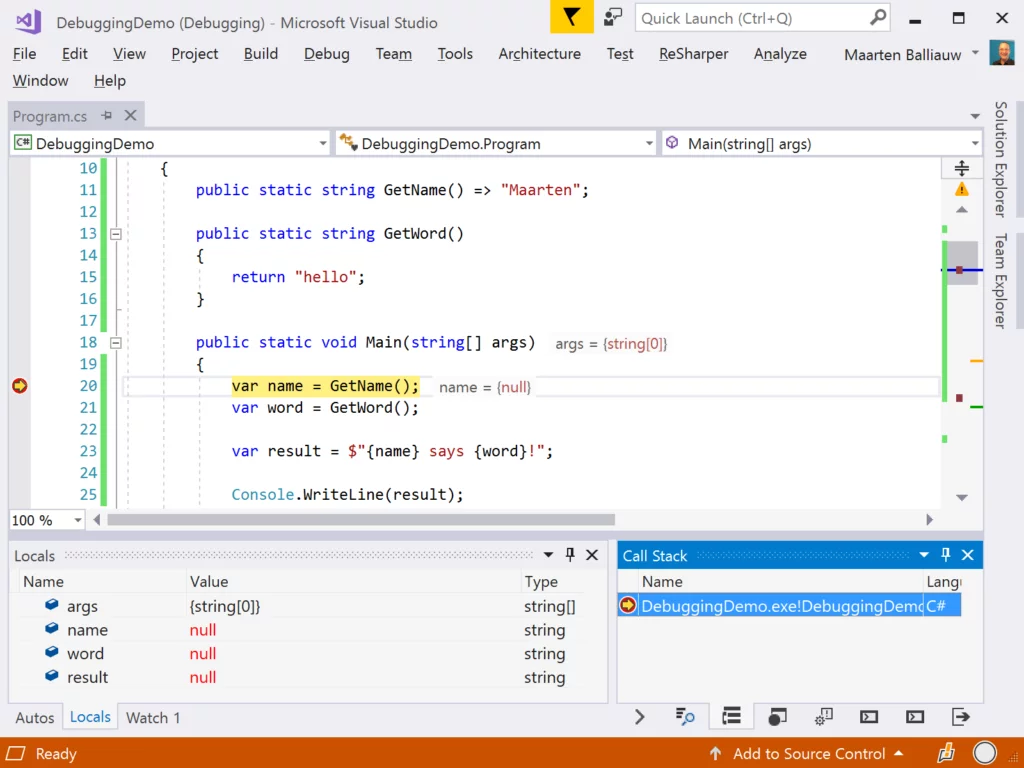
ReSharper is a productivity and debugging extension for Visual Studio, designed to improve the coding experience for .NET developers. It offers powerful code analysis, refactoring, navigation, and unit testing tools that help developers write clean, efficient, and maintainable code.
Pros:
- Comprehensive Code Assistance: Real-time code analysis, automated refactoring, and more.
- Powerful Profiling Tools: Includes performance profiling to help developers optimize their code.
- Multi-language Support: Works across a wide range of .NET languages.
Cons:
- Visual Studio Only: ReSharper is designed specifically for Visual Studio, so it’s not useful for developers working outside of this IDE.
- Resource Intensive: ReSharper can be resource-heavy, which may impact performance on lower-end machines.
Why ReSharper is the Top Choice for .NET Developers
ReSharper is a top-tier tool for .NET developers, offering powerful debugging, refactoring, and analysis tools that ensure clean, efficient, and high-quality code.
5. Memfault
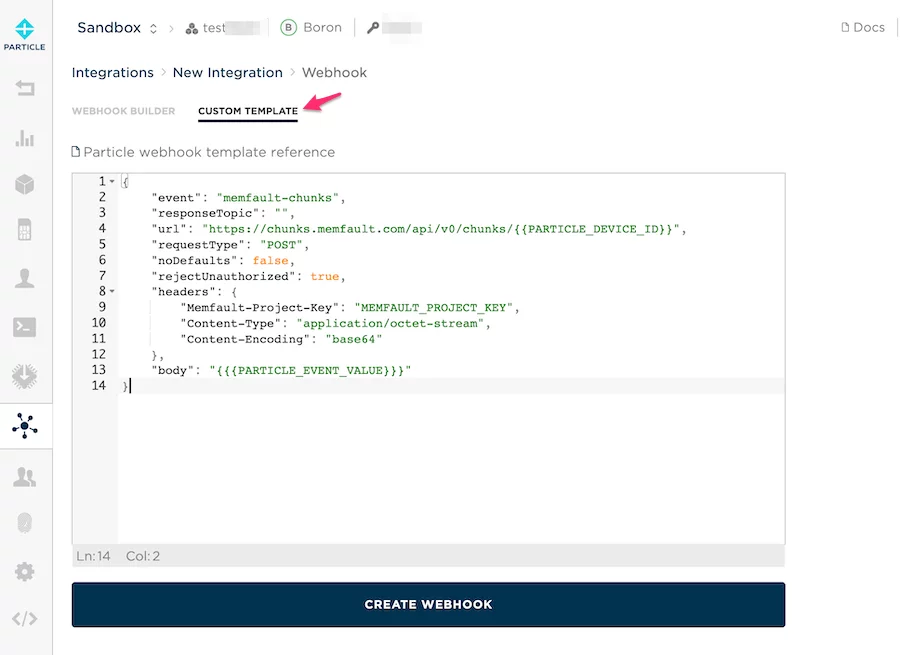
Memfault is a cloud-based platform designed to optimize the software development process, particularly for industries where device reliability is critical, such as Internet of Things (IoT), smart homes, industrial automation, and healthcare.
The platform offers remote monitoring, proactive debugging, and real-time device updates, helping development teams identify and fix issues before they impact end users. This results in improved product reliability, faster issue resolution, and enhanced customer satisfaction.
Pros of Memfault:
- Real-Time Monitoring and Proactive Issue Resolution: Enables remote debugging and issue detection, reducing downtime and preventing critical bugs from affecting end users.
- Optimized for IoT and Embedded Systems: Memfault’s tools are tailored to address the unique challenges of IoT devices, ensuring that developers can manage devices effectively in real-time.
- Modular and Flexible: Supports a variety of platforms, including Android and RTOS, making it adaptable to various hardware and software configurations.
- Improved Product Reliability: By providing early bug detection and real-time performance monitoring, Memfault enhances device reliability and ensures a better user experience.
Cons of Memfault:
- Requires Cloud Integration: As a cloud-based platform, Memfault depends on reliable internet access for real-time monitoring and updates. This could be a limitation in environments with poor connectivity.
- Primarily Focused on IoT and Embedded Systems: While its specialization in IoT is a strength, Memfault may not be as suitable for developers working on non-IoT or non-embedded applications.
- Learning Curve for New Users: Developers unfamiliar with embedded systems or IoT-specific challenges might face a learning curve when first integrating Memfault into their workflow.
Why Memfault Is Ideal for IoT and Device-Focused Development:
Memfault is an excellent choice for teams working on IoT or embedded systems that require constant monitoring and proactive debugging. Its ability to remotely track device performance, detect anomalies, and address issues in real time makes it invaluable in fields where device reliability is non-negotiable.
Behind the Scenes: Best Debugging Techniques Every Developer Should Deploy
1. 📜 Master the Art of Logging: The Developer’s Diary
Logging is an essential debugging software technique that provides critical insights into how your application behaves during development. Think of logs as the code’s diary, giving you a glimpse of what’s functioning well and where bugs are occurring.
However, to use logs effectively, it’s crucial to know what to log and when—too much data can overwhelm you, while too little leaves gaps in your understanding.
Use Different Log Levels:
By categorizing logs based on severity, you can prioritize and filter information, making it easier to identify and address issues. Common log levels include:
- Info: General updates about the application’s state (e.g., user actions, successful operations).
- Warn: Non-critical issues that don’t stop execution but indicate potential concerns (e.g., deprecated API usage).
- Error: Critical issues that disrupt functionality (e.g., database failures, network errors).
- Debug: Detailed insights for troubleshooting during development (e.g., variable values, function calls).
Time Your Logs for Performance Insights:
For performance-related debugging tools in software testing, logging timestamps or measuring execution time allows you to identify slow operations and performance bottlenecks.
Keep Logs Focused:
Excessive logging can clutter your console, making it harder to track relevant data. Focus on logs that help debugging software or monitor the health of your application.
🚀 Bonus Tip for JavaScript Developers:
Consider using logging libraries like Winston, which offers structured log formatting, log level management, and external log routing, enhancing the clarity and usability of your logs.
2.⏱️ Profiling for Performance: Identifying Bottlenecks
Performance bugs, like CPU bottlenecks, memory leaks, or inefficient algorithms, can be just as challenging to debug as logical errors. Profilers—powerful debugging tools in software testing—help pinpoint areas where resources are being consumed inefficiently.
Types of Profiling to Master:
- CPU Profiling: Helps identify which functions consume excessive CPU resources, allowing you to optimize them for better performance.
- Memory Profiling: Assists in detecting memory leaks by tracking memory allocation and release, ensuring optimal application performance.
Profiling Tools You Should Know:
- Chrome DevTools (for web apps)
- PyCharm Profiler (for Python)
- Visual Studio Profiler (for .NET apps)
Why it Matters:
Profiling tools not only aid in debugging software but also optimize performance, ensuring your app runs faster and more reliably under load.
3. 🧪 Leverage Unit Testing for Efficient Debugging
Unit tests serve as both validation and debugging tools. By testing individual components, you can quickly pinpoint where issues arise when a bug appears.
Why Unit Testing is a Debugging Game-Changer:
- Immediate Feedback: Unit tests provide instant feedback on failures, allowing you to address issues right away without sifting through the entire codebase.
- Isolate the Issue: Since unit tests focus on isolated parts of code, they make debugging more efficient by pinpointing where the failure occurred.
💡 Pro Tip:
Combine Test-Driven Development (TDD) with unit testing. Writing tests before the code helps prevent many common bugs, resulting in cleaner, more maintainable code.
4.🛡️ Automate Debugging with Linters: Catch Errors Early
Linters act as automatic debugging tools that scan your code for syntax errors, logical flaws, and style issues. These tools prevent small mistakes from growing into major bugs.
Popular Linters for Different Languages:
- ESLint (for JavaScript/TypeScript): Detects common issues like missing semicolons or unused variables.
- Pylint (for Python): Identifies undefined variables and code style violations.
- SonarLint (for multiple languages): Works across tech stacks to catch potential errors before they escalate.
Why it Matters:
Linters provide immediate feedback, enabling you to catch errors before running the code, which helps avoid future debugging headaches.
💡 Pro Tip:
Automate the linting process in your CI/CD pipeline or integrate it with your IDE, ensuring errors are caught as you code.
5. 🕵️♂️ Track Down Bugs with Git Bisect: The Detective Tool
Tracking down a bug across a large commit history can feel like a detective case. Fortunately, git bisect is a powerful tool that helps you pinpoint the exact commit that introduced the bug by performing a binary search.
How Git Bisect Works:
- Mark the “Good” Commit: Identify a commit where everything was working fine.
- Mark the “Bad” Commit: Find a commit where the bug is reproducible.
- Run Git Bisect: Git will narrow down the commit range and identify the exact commit that introduced the bug.
Why it Matters:
Git bisect speeds up the process of identifying the source of a bug, especially in large codebases, saving you time and effort.
💡 Pro Tip:
Git bisect is ideal for legacy codebases where bugs may have been introduced over multiple commits, streamlining the debugging software process.
6. 🌐 Debug Asynchronous Code: Handle Complexity with Ease
Asynchronous code, such as promises and async/await, can complicate debugging because it doesn’t follow a straightforward, linear execution flow. Effective debugging of async code is essential to managing this complexity.
Key Strategies for Debugging Async Code:
- Use async/await Instead of Promises: Async/await simplifies asynchronous code, making it easier to follow and debug by reducing callback nesting.
- Use Async Stack Traces: Modern debugging tools in software testing, like Chrome DevTools, support async stack traces that allow you to trace errors through async calls and promises, helping you find issues in deeply nested functions.
💡 Pro Tip:
Using async/await not only simplifies debugging but also makes error handling cleaner and more predictable, enhancing code readability and manageability.
Achieve Flawless Code with the Best Debugging Tools: Winding Up
Debugging is a crucial part of maintaining and optimizing a high-performance website. Identifying and resolving issues quickly is essential to ensure that your site runs smoothly and delivers a positive experience for users. The best debugging tools can help you pinpoint and fix problems efficiently, whether they are related to performance, errors, or unexpected behavior in your code.
Even the most advanced debugging tools can be hindered if the underlying hosting environment is unstable, slow, or prone to technical issues. This is where Nestify stands out.
By pairing powerful debugging tools in software testing with a stable hosting platform like Nestify, you can focus on improving your website’s functionality without worrying about server issues. With Nestify, your debugging process becomes more efficient thanks to its reliable server environment.
This stability lets you confidently address errors, test performance, and optimize your site, ensuring smoother development. Start your free trial today and experience the difference!
FAQs on Mastering Breakpoints with Best Debugging Tools
What are breakpoints and how do they work?
A breakpoint is a marker that tells the debugger to pause the program’s execution at a specific line of code. You can set breakpoints manually or programmatically. When the breakpoint is hit, the debugger halts execution, allowing you to inspect variables, check the call stack, or execute code step by step.
How do I debug in a production environment?
In a production environment, debugging can be trickier because you don’t want to introduce performance issues or disrupt users. Use tools like logging, remote debuggers, and error tracking services (e.g., Sentry) to gather information without impacting users. Always be cautious and avoid exposing sensitive data in logs.
What is a “heisenbug”?
A heisenbug is a type of software bug that disappears or changes behavior when you try to observe or debug it. This can happen due to factors like timing, optimization, or environment conditions. Heisenbugs are difficult to reproduce and debug, but adding more detailed logging or using specialized debugging tools may help uncover their root cause.
