
Are you a PHP developer looking to streamline your debugging process using Xdebug and VsCode or do you want to find and fix errors in your PHP code more efficiently?
Debugging is an essential part of software development that allows developers to identify and fix issues in their code. In the world of PHP development, one of the most powerful and popular debugging tools is Xdebug. When combined with the versatile code editor VsCode, developers can enhance their debugging experience and streamline their workflow.
In this extensive guide, I will provide a step-by-step walkthrough on how to effectively debug PHP code using the powerful combination of Xdebug and VsCode. Debugging plays a pivotal role in a developer’s toolkit, enabling efficient troubleshooting and boosting productivity.
By leveraging the appropriate tools and adopting best practices, you can streamline your debugging process. Let’s delve into the intricacies of debugPHP with Xdebug and VsCode to sharpen your skills and enhance your development workflow!
Understanding the Importance of Debugging
Prior to delving into the intricacies of debugging PHP, it is imperative to recognize the significance of this skill in a developer’s repertoire. Debugging facilitates the identification and resolution of errors, exceptions, and bugs within your codebase. It empowers you to guarantee the smooth and efficient functioning of your PHP applications, offering a seamless user experience. Proficient debugging not only saves time and minimizes frustration but also elevates the overall quality of your applications.
Setting Up Xdebug and VsCode
To begin debugging PHP with Xdebug and VsCode, you first need to set up the necessary tools and configurations. Let’s go through the step-by-step process of getting everything up and running.
Prerequisites:
- PHP development environment (minimum PHP 7.0)
- Visual Studio Code (compatible with your operating system)
Step 1: Install Xdebug Extension
The Xdebug extension is a powerful tool that enables debugging capabilities in PHP. To install Xdebug, follow these steps:
- Open your terminal or command prompt.
- Run the appropriate command based on your PHP version and operating system. You can find the installation instructions on the official Xdebug website.
Step 2: Configure PHP to Use Xdebug
After installing Xdebug, you need to configure your PHP installation to use the extension. Here’s how you can do it:
- Locate your PHP configuration file (php.ini).
- Open the configuration file using a text editor.
- Find the line that starts with “zend_extension” or “extension” and add the path to the Xdebug extension file.
- Start the installation and follow the directions on the screen.
Step 3: Install the VsCode Editor
VsCode is a popular code editor that provides excellent support for debugging PHP. To install VsCode, follow these steps:
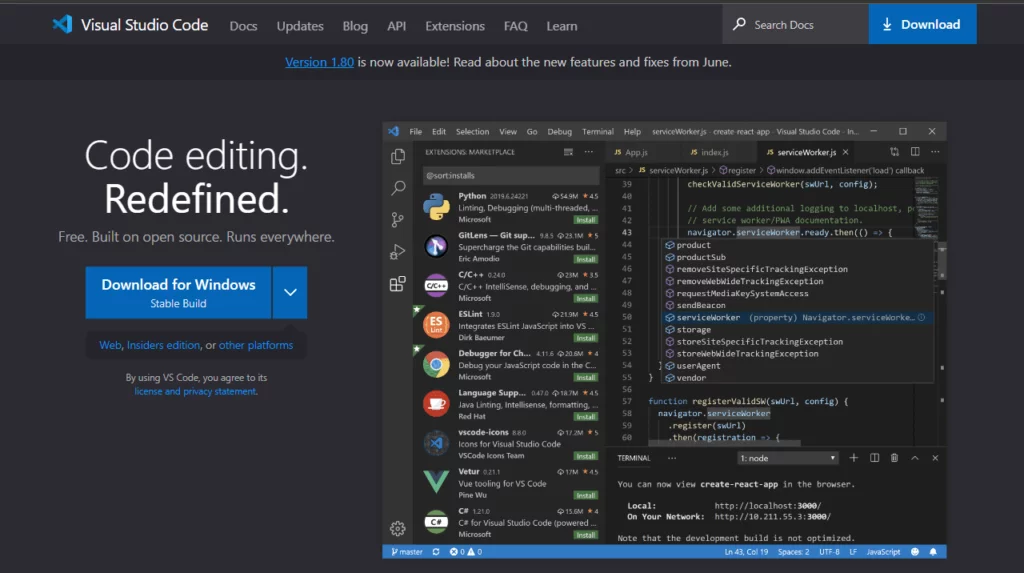
- Visit the VsCode website and download the appropriate version for your operating system.
- Start the setup and follow the on-screen directions.
- Once the installation is complete, launch VsCode.
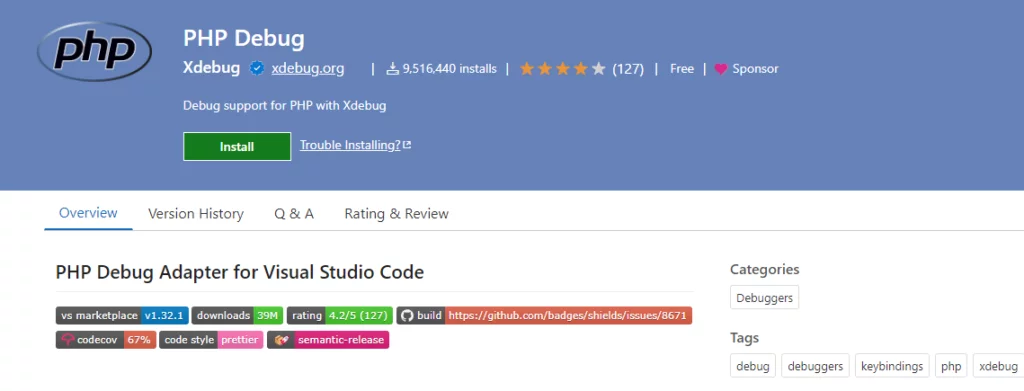
Step 4: Install the PHP Debug Extension
In order to debug PHP code in VsCode, you need to install the PHP Debug extension. Here’s how you can do it:
- Open VsCode.
- Navigate to the Extensions view by clicking on the square icon in the sidebar or pressing Ctrl+Shift+X.
- Search for “PHP Debug” in the search bar.
- Click on the “Install” button next to the PHP Debug extension.
- Wait for the installation to complete, and then click on the “Reload” button to activate the extension.

Congratulations! You have successfully set up Xdebug and VsCode for debugging PHP code. Now, let’s move on to the next section and explore the debugging process in detail.
Learn Debug PHP with Xdebug and VsCode
Starting a Debugging Session
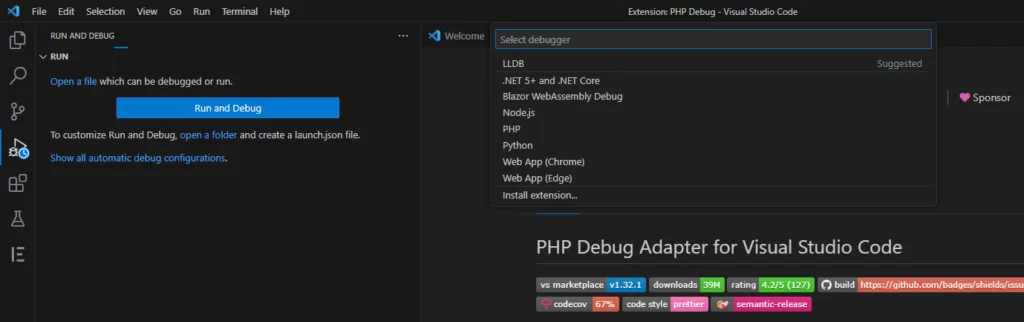
To start a debugging session in VsCode, follow these steps:
- Open the PHP file you want to debug in VsCode.
- Set a breakpoint by clicking on the line number where you want the execution to pause.
- Launch the debug view in VsCode by clicking on the bug icon in the sidebar or pressing Ctrl+Shift+D.
- F5 or click the “Start Debugging” button to begin debugging.
Stepping Through the Code
Once the debugging session starts, you can step through your PHP code to examine its execution and identify any issues. VsCode provides several options for stepping through the code:
- Step Over (F10): Executes the current line of code and moves to the next line. If the current line contains a function call, it will be executed entirely, and the execution will move to the next line in the calling code.
- Step Into (F11): If the current line contains a function call, the execution will move inside the called function, allowing you to debug its code.
- Step Out (Shift+F11):If you are currently inside a function, the execution will move out of the function, back to the calling code.
- Continue (F5): Resumes the execution of the code until the next breakpoint or the end of the script.
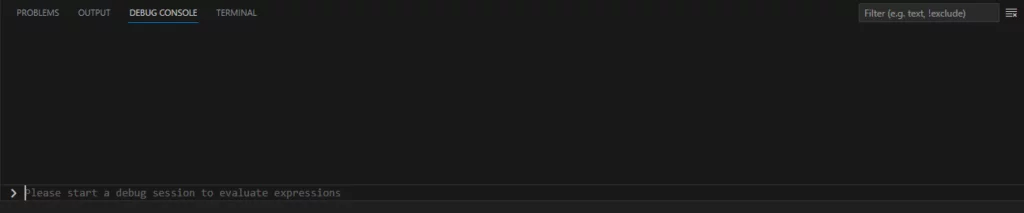
Inspecting Variables
Examining the values of variables at various locations within your code frequently is essential during a debugging session. You may achieve it by using the variables view provided by VsCode. How to inspect variables is as follows:
- While debugging, open the Variables view in VsCode by clicking on the square icon in the sidebar or pressing Ctrl+Shift+Y.
- The Variables view will display a list of all variables in the current scope.
- Click on the arrow next to a variable to expand it and view its current value.
Setting Watch Expressions
Watch expressions in VsCode allow you to monitor the values of specific variables continuously. Follow these steps to create a watch expression:
- Open the Watch view in VsCode by clicking on the eye icon in the sidebar or pressing Ctrl+Shift+W.
- To add a new watch phrase, use the “+” button.
- Enter the name of the variable you want to monitor and press Enter.
Handling Exceptions
When debugging PHP code, you may encounter exceptions that need to be handled. VsCode provides options to pause the execution when an exception is thrown and inspect the exception details. To enable exception handling, follow these steps:
- Open the Debug view in VsCode by clicking on the bug icon in the sidebar or pressing Ctrl+Shift+D.
- To access the launch .json file, click the gear button
- Add the following configuration inside the “configurations” array:
json
"exception_handling": {
    "stopOnEntry": false,
    "throwOnUnchecked": true,
    "breakOnCaughtException": true,
    "breakOnUncaughtException": true
}
Debugging Remote PHP Applications
VsCode also supports debugging PHP applications running on remote servers. To debug a remote PHP application, you need to set up a remote debugging configuration in VsCode. To do so follow the below procedure of Debugging Remote PHP Applications.
- Install the Xdebug extension on the remote server.
- Configure the remote PHP installation to use Xdebug.
- Set up an SSH connection to the remote server in VsCode.
- Create a launch configuration in VsCode that specifies the remote debugging settings
- You can do this by opening the launch.json file in the project folder and adding the following configuration:
{
  "type": "php",
  "request": "launch",
  "name": "Debug PHP",
  "program": "${file}",
  "port": 9000,
  "stopOnEntry": true
}
6. Start debugging by pressing F5.
Please refer to the VsCode documentation for more detailed instructions on debug PHP applications.
Conclusion
In this extensive guide, we’ve covered the ins and outs of debug PHP code with Xdebug and VsCode. Debugging is an essential skill for PHP developers, and with the right tools and techniques, you can effectively identify and fix issues in your code. We explored the process of setting up Xdebug and VsCode, starting a debugging session, stepping through the code, inspecting variables, and handling exceptions.
Additionally, we touched upon debug PHP on remote applications and provided answers to common FAQs. By mastering the art of debugging PHP, you can enhance your development workflow and create more robust and reliable PHP applications.
FAQs on Debug PHP
1: What is Xdebug, and why is it used for Debug PHP?
Xdebug is a powerful PHP extension that provides debugging and profiling capabilities. It allows developers to track the execution of PHP code, inspect variables, set breakpoints, and more. Xdebug is widely used for PHP debugging because of its robust features and seamless integration with popular code editors like VsCode.
2: Can I debug PHP code without using Xdebug?
While Xdebug is the most popular and feature-rich tool for debug PHP, there are alternative options available. For example, you can use PHP’s built-in var_dump() function or log messages to a file for basic debugging. However, these methods may not offer the same level of convenience and functionality as Xdebug.
3: Does Xdebug slow down PHP performance?
Xdebug does introduce some overhead because it adds extra functionality to PHP’s execution process. However, the impact on performance is minimal and usually negligible in most cases. It’s recommended to enable Xdebug only when you need to debug your code and disable it in production environments.
4: Can I debug PHP code in other code editors apart from VsCode?
Yes, Xdebug is compatible with various code editors, including PhpStorm, Eclipse, NetBeans, and Sublime Text. Each editor may have its own set of configurations and debugging features, so you’ll need to refer to the respective editor’s documentation for setting up PHP debugging with Xdebug.
5: Are there any alternatives to VsCode for PHP development?
Indeed, there exist numerous alternatives to VsCode for PHP development, including PhpStorm, NetBeans, Eclipse, and Sublime Text. Each editor possesses its unique range of features, making the choice a subjective matter influenced by personal preferences and specific requirements. It is beneficial to explore multiple editors to identify the one that aligns most effectively with your needs.
