
When measuring performance using a specific visitor profile, the process may sometimes fail, resulting in no insights being provided. This failure can occur for various reasons, such as the web page’s content structure, hosting limitations, or access restrictions from the profile.
Initially, it’s best to re-check the test, though this may not always resolve the issue. If the problem persists, we recommend editing the measurement to remove the failing visitor profile. Removing the profile ensures that Performance credits are fully refunded, making them available for other measurements.
If the page title appears as “Access Denied,” it is likely because the performance checks are being blocked. Before we dig into the reasons why performance checks fail, let’s first understand what performance metrics are important.
Performance Terminology
Performance metrics are quantitative measures used to evaluate the efficiency and effectiveness of a website’s performance. They provide insights into how quickly and smoothly a web page loads and reacts to user interactions. Key performance metrics include:
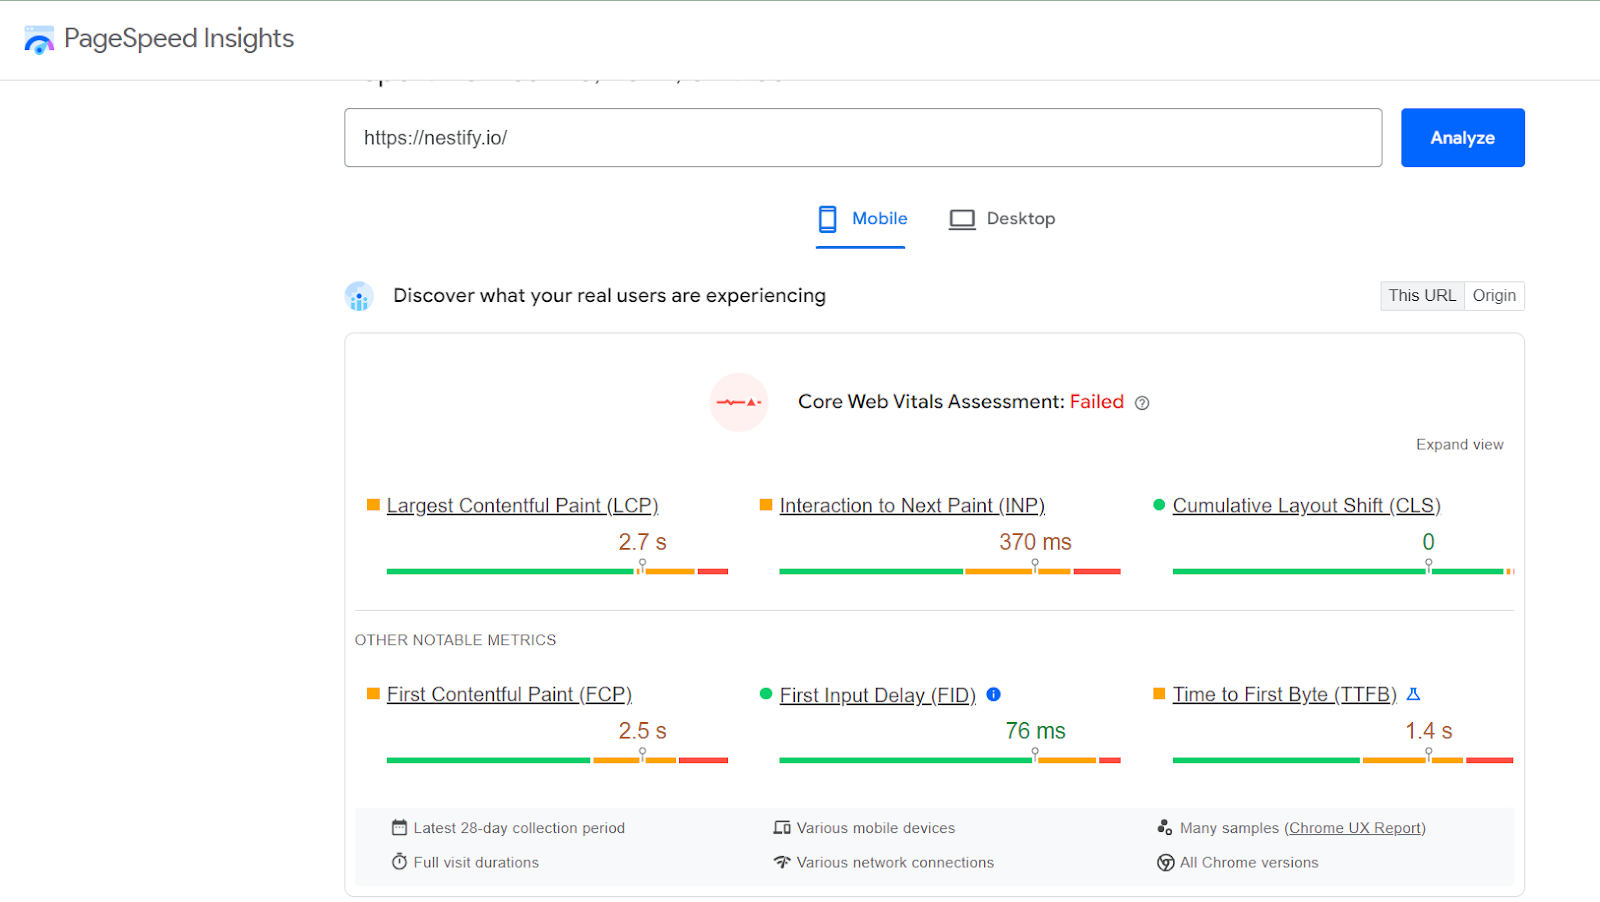
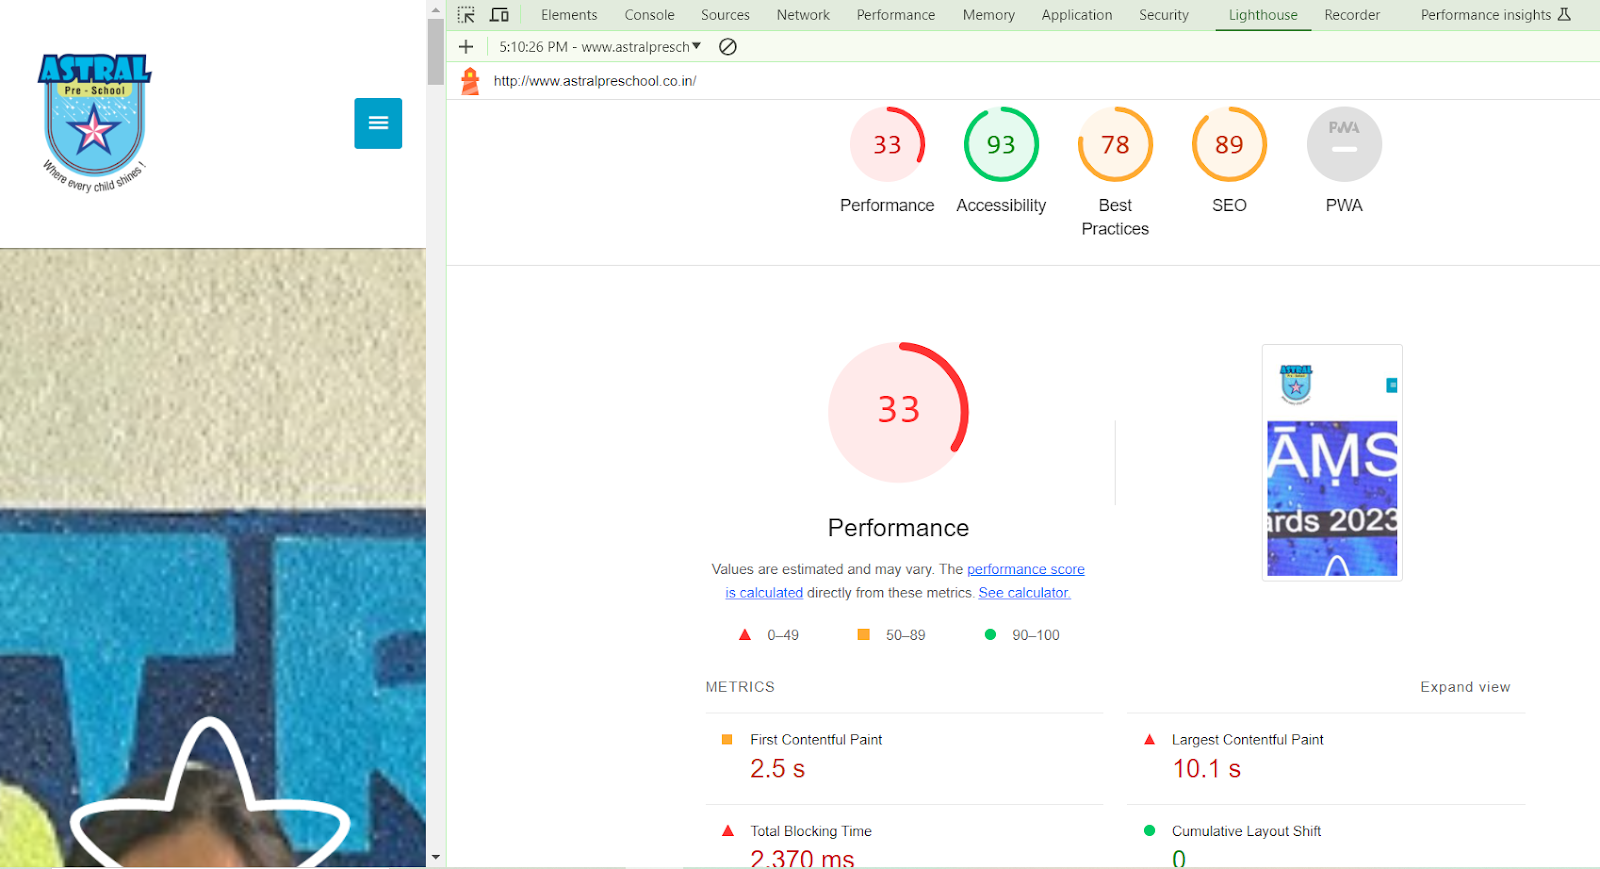
1. First Contentful Paint (FCP): Calculates the time it takes for the first piece of content to pop on the screen. This helps gauge how quickly a page starts to load.
2. Time to Interactive (TTI): Calculates the time it takes for the website page to transform into a fully interactive one, meaning it responds quickly to user inputs.
3. Largest Contentful Paint (LCP): Calculates the time it takes for the largest bulk of content (e.g., an image or text block) to become visible within the viewport. This indicates when the main content of the page has loaded.
4. Total Blocking Time (TBT): Calculates the total time during which the main thread is blocked and not able to respond to user inputs, usually caused by heavy JavaScript execution.
5. Cumulative Layout Shift (CLS): Calculates the visual stability of the page by tracking how often and how much visible content shifts during loading. A low CLS score indicates a stable page.
6. Speed Index: Measures how quickly the content of a page is visibly populated. It is a composite metric that considers the visual progression of page loading.
7. First Input Delay (FID): Calculates the time from when a user first interacts with a page (e.g., clicking a button) to when the browser begins processing that interaction.
These metrics help developers and site owners identify areas where performance can be improved, ensuring a better user experience and considerably higher search engine rankings.
Common Reasons Why a Performance Check Might Fail
Reason #1: The page is behind a login
Sometimes, the performance module does not support checking pages that require login authentication.
How to fix this issue?
To address the issue of performance check failing because the page is behind a login, you can try the following solutions:
1. Create a Public Version of the Page:
• Public Test Page: Develop a public version of the page that does not require login authentication. This version can be used solely for performance testing purposes.
• Access Control: Ensure sensitive or personal information is removed or obfuscated on this public test page.
2. Use Authentication Tokens or Temporary Access:
• Temporary Access Links: Generate temporary access links that bypass the login for performance testing. Ensure these links have limited validity to maintain security.
• Authentication Tokens: Implement a system where the performance testing tool can use an authentication token or API key to access the page without a traditional login process.
Reason #2: No Access to the Page Being Checked
At times, when performance tries to access a specific web page using a certain visitor profile, the page may not be available to the simulated visitor. This prevents sites from generating any valuable data for that page measurement. Common reasons for this performance check include:
• Geo-blocking
• Issues with the server infrastructure hosting the page
• Expired SSL certificates
• The user-agent used to check the page is blocked
How do we fix these issues?
To ensure smooth access and accurate performance measurements, follow these steps:
1. Ensure These Issues Are Not Preventing Access to the Page:
• Server Issues: Check if the server hosting the page is running correctly and has no outages or connectivity issues.
• DNS Configuration: Verify that the domain name system (DNS) settings are correctly configured to resolve the page URL.
• Firewall Settings: Ensure that firewalls or security settings are not blocking access to the page from specific IP addresses or visitor profiles
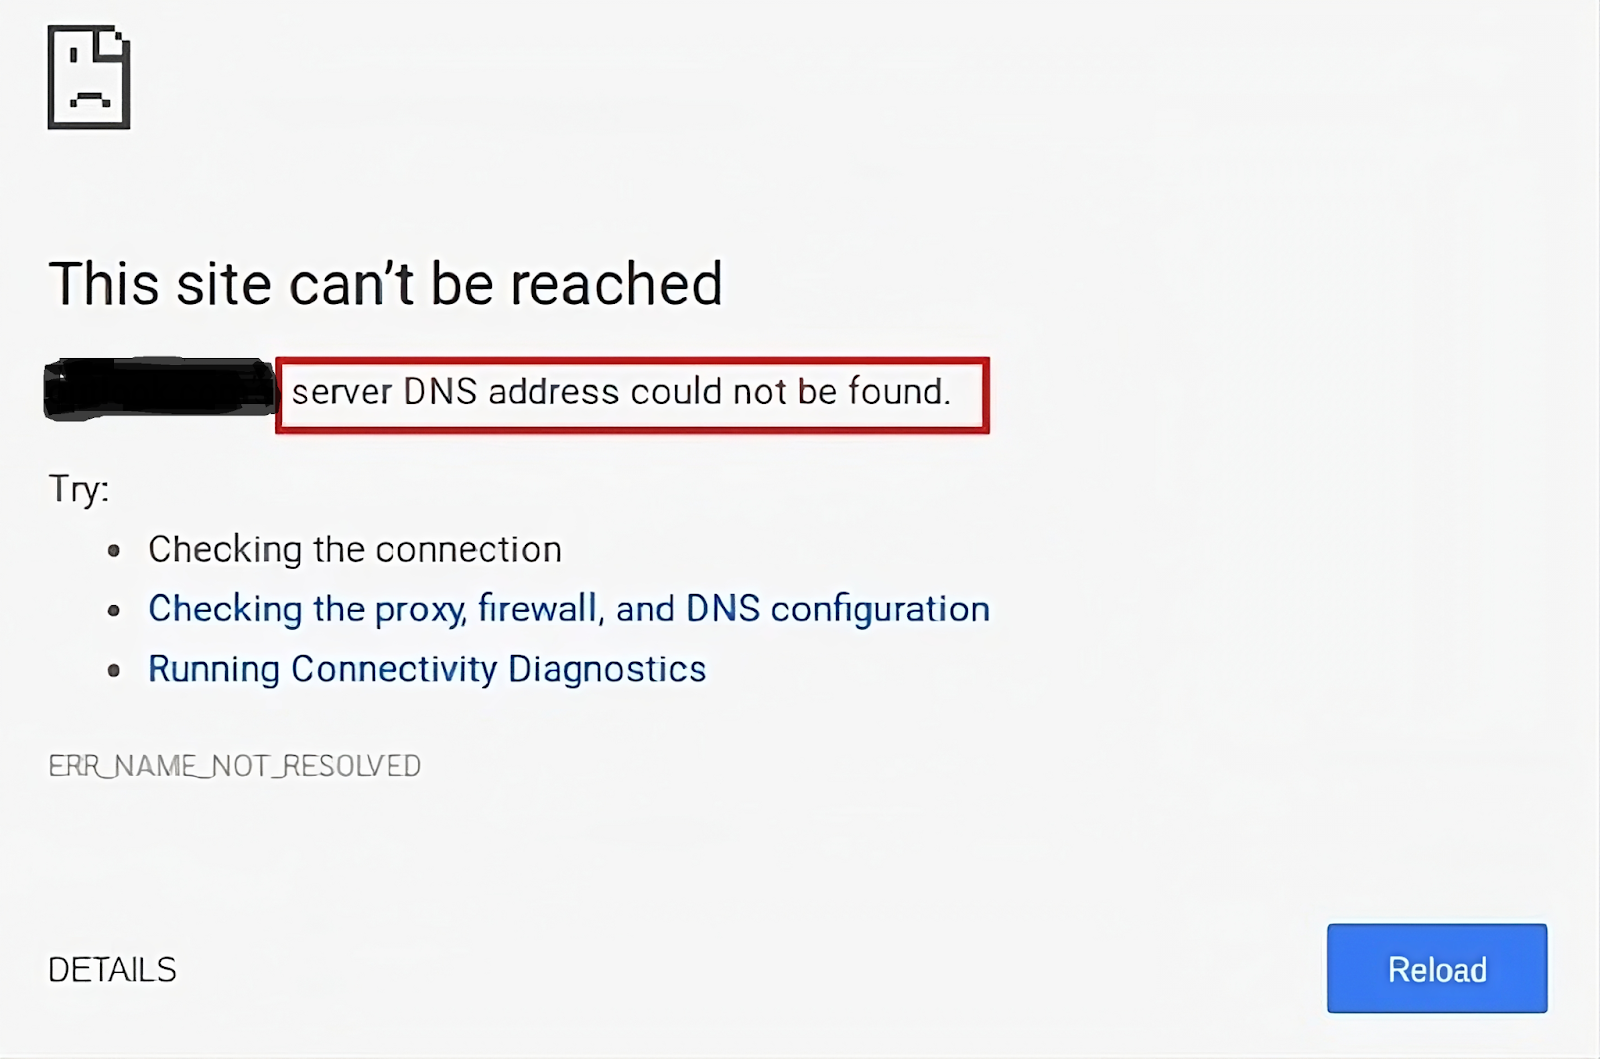
Suggested Read: How to Fix DNS Server Not Responding Error in WordPress
2. Verify the Page Has a Valid SSL Certificate:
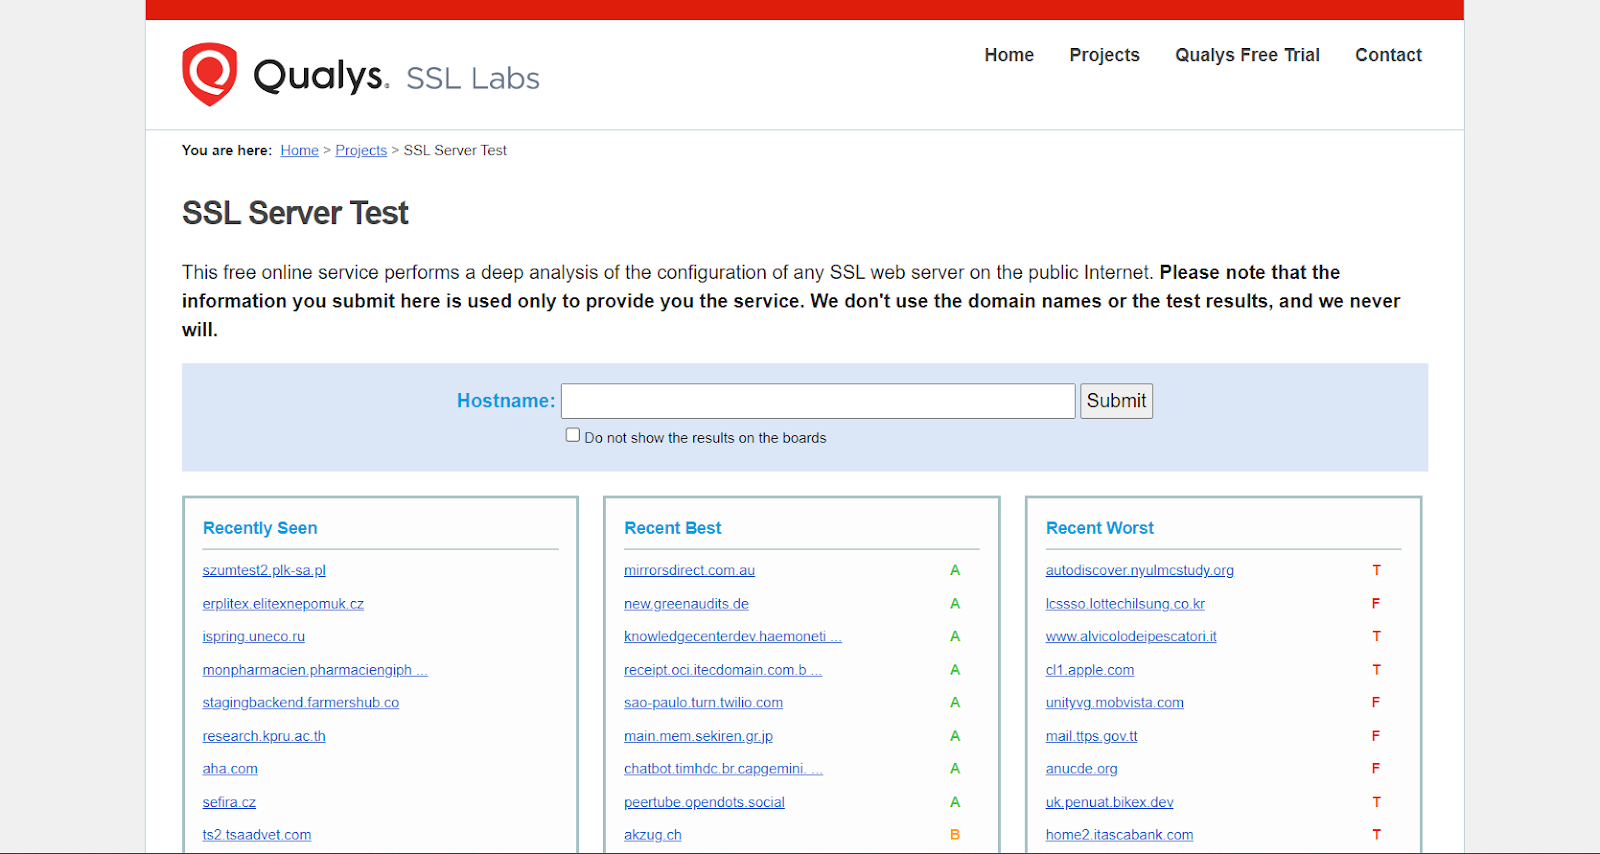
• SSL Certificate Validity: Ensure that the SSL certificate for the website is valid and not expired. An expired certificate can prevent access and cause security warnings for users. Check it on Qualys:
• Proper Installation: Check that the SSL certificate is correctly installed and configured on the server. Misconfigurations can lead to errors or inaccessible pages.
• Certificate Authority (CA): Make sure the SSL certificate is issued by a trusted certificate authority. Browsers may block access to sites with certificates from untrusted sources.
3. Confirm There Is No Geo-Blocking for the Region Used in the Visitor Profile:
• Regional Access Restrictions: Verify that the website does not restrict access based on geographical location. Geo-blocking can prevent users in certain regions from accessing the site.
• Visitor Profile IP Range: Ensure that the IP range used for the visitor profile is not blocked by the website’s geo-blocking settings.
• Content Delivery Network (CDN) Configuration: If using a CDN, check that it does not impose regional restrictions that could affect access for the specified visitor profile.
By addressing these areas, you can prevent access issues and ensure that performance measurements are accurate and reliable.
Reason #3: Timeout When Generating Specific Metrics
Google uses a scoring system called Lighthouse to calculate and determine the relative performance of a page for different visitor profiles. This involves translating various specific performance check metrics (such as First Contentful Paint and Time to Interactive) into an overall performance score and impact assessment.
However, in some cases, the generation of specific performance check metrics may take too long to be considered valid. A common example is Time to Interactive (TTI). For very heavy and slow pages, TTI measures the point when a page transforms into a fully interactive one, meaning it’s ready to receive user input without noticeable delay, ensuring an acceptable user experience.
If a page takes too long (usually over 90 seconds) due to heavy scripting, this delays the TTI metric, preventing the performance check from completing. Consequently, the overall scoring system cannot generate a result because of the missing metrics.
How to fix these issues?
In such cases, it’s best to initially improve the page’s performance using general recommendations in the diagnostics report provided by the Lighthouse. This should help reduce metric timeouts, allowing Performance to generate specific checks and audits for the given page and visitor profiles.
Conclusion
Website performance measurements can fail for several reasons, often rooted in technical and access-related issues. By proactively managing these factors, website owners can enhance the reliability of performance measurements and gain valuable insights to improve user experience.
FAQs
Can network problems cause performance check failures?
Yes, network problems such as connectivity issues, bandwidth limitations, or high latency can hinder the smooth functioning of a website and result in failed performance checks.
What role does website traffic play in performance check failures?
High volumes of website traffic can strain servers and slow down response times, causing performance checks to fail or produce unreliable results.
How does inefficient code affect website performance?
Inefficient or poorly optimized code can increase load times, decrease responsiveness, and cause performance checks to fail due to excessive resource consumption.
