
How do you, as a business owner of an online store, navigate the ever-expanding digital landscape, where every click, swipe, and interaction is measured in milliseconds? If you don’t want to make or break your user experience every millisecond, consider performance analysis important.
From e-commerce platforms to streaming services, you grapple with the challenge of delivering seamless, lightning-fast interactions to demanding consumers. Amidst this, a critical problem looms large: the escalating complexity of digital systems and applications.
As you embrace digital transformation, your infrastructures become increasingly intricate, comprising a myriad of interconnected components and dependencies. This complexity gives rise to performance bottlenecks, latency issues, and system failures that can undermine user satisfaction and erode brand reputation. Thus, the ability to identify and address performance issues swiftly becomes imperative for maintaining competitiveness and ensuring customer loyalty.
What is Performance Analysis?
Performance analysis is like peeling back the layers of our digital ecosystem, revealing insights vital for optimization and success. It’s not just about evaluating how fast our system, application, or website responds; it’s about delving into the intricacies of its performance across multiple dimensions.
Response time, the heartbeat of user experience, measures how swiftly our system reacts to user input. Throughput quantifies our capacity to handle concurrent requests, offering a glimpse into scalability and resilience under heavy loads. Resource utilization tracks the consumption of computational resources such as CPU, memory, and disk, highlighting potential inefficiencies or overloads that could impede performance.
Moreover, scalability, a cornerstone of modern architecture, assesses how well our system adapts to increasing demands, ensuring seamless growth without compromising performance.
By meticulously analyzing these metrics, we unearth performance bottlenecks lurking within our digital infrastructure. Whether it’s a poorly optimized algorithm, an under-provisioned server, or a network bottleneck, performance analysis shines a spotlight on areas ripe for improvement.
Armed with this knowledge, you can reallocate resources, fine-tune configurations, and implement optimizations that enhance user experience and drive your business objectives.
Essential Tools for Performance Analysis
1. Profiling Tools
Profiling tools are like detectives for coding, meticulously examining their behavior to uncover inefficiencies and performance bottlenecks. These tools provide a deep dive into the inner workings of your applications, revealing insights that are crucial for optimization.
At their core, profiling tools track various metrics such as CPU usage, memory consumption, and execution time for different parts of our codebase. They offer detailed analyses of function calls, method invocations, and memory allocations, allowing you to pinpoint precisely where your code spends its time and resources.
With this granular level of visibility, you can identify performance hotspots, inefficient algorithms, or memory leaks that may be slowing down our application. Profiling tools highlight areas of code that could benefit from optimization, whether it’s reducing the frequency of expensive operations, optimizing data structures, or refactoring code for better efficiency.
Moreover, profiling tools often provide visualization features, such as call graphs or flame graphs, which offer intuitive representations of code execution paths and resource usage. These visualizations help you grasp complex relationships within your codebase and prioritize optimization efforts effectively.
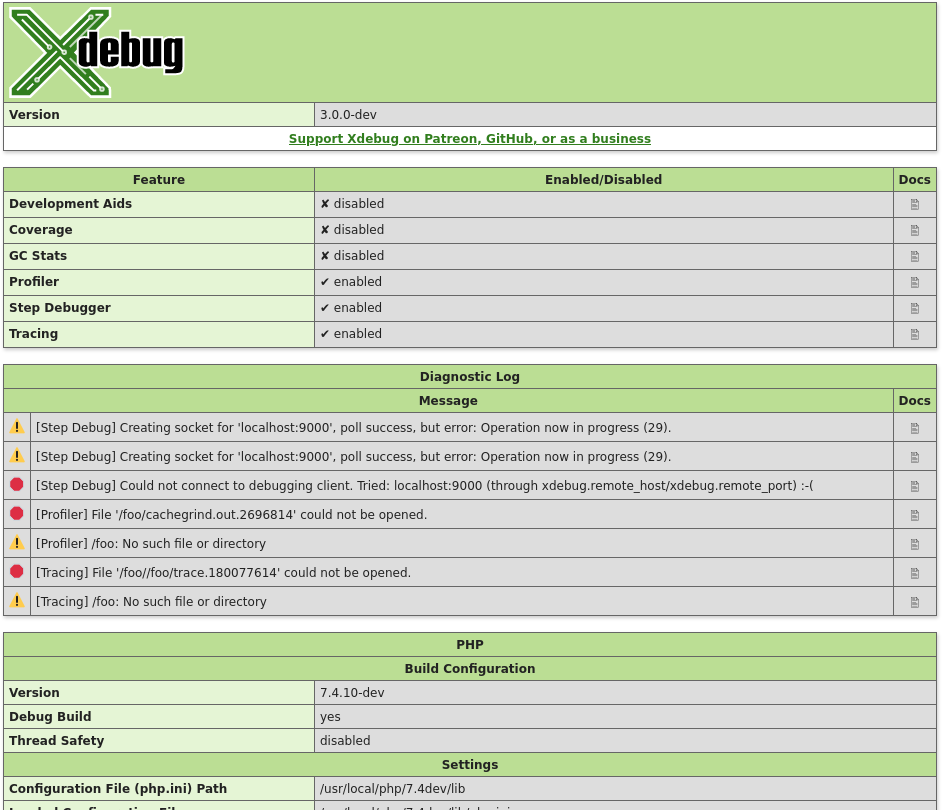
Profilers `Intel VTune`, `Java VisualVM`, and `Xdebug` provide insights into code execution, memory usage, and CPU utilization. They help developers pinpoint performance hotspots and optimize code for better efficiency.
2. Load Testing Tools
Load testing tools are the stress testers of digital infrastructure, simulating real-world user traffic to evaluate how our systems perform under different loads and conditions. These tools allow you to subject your applications, websites, or services to simulated bursts of activity, measuring their response times, throughput, and scalability.
With load testing tools, you can simulate thousands or even millions of virtual users accessing our system simultaneously, replicating scenarios that mimic peak usage periods or unexpected spikes in traffic.
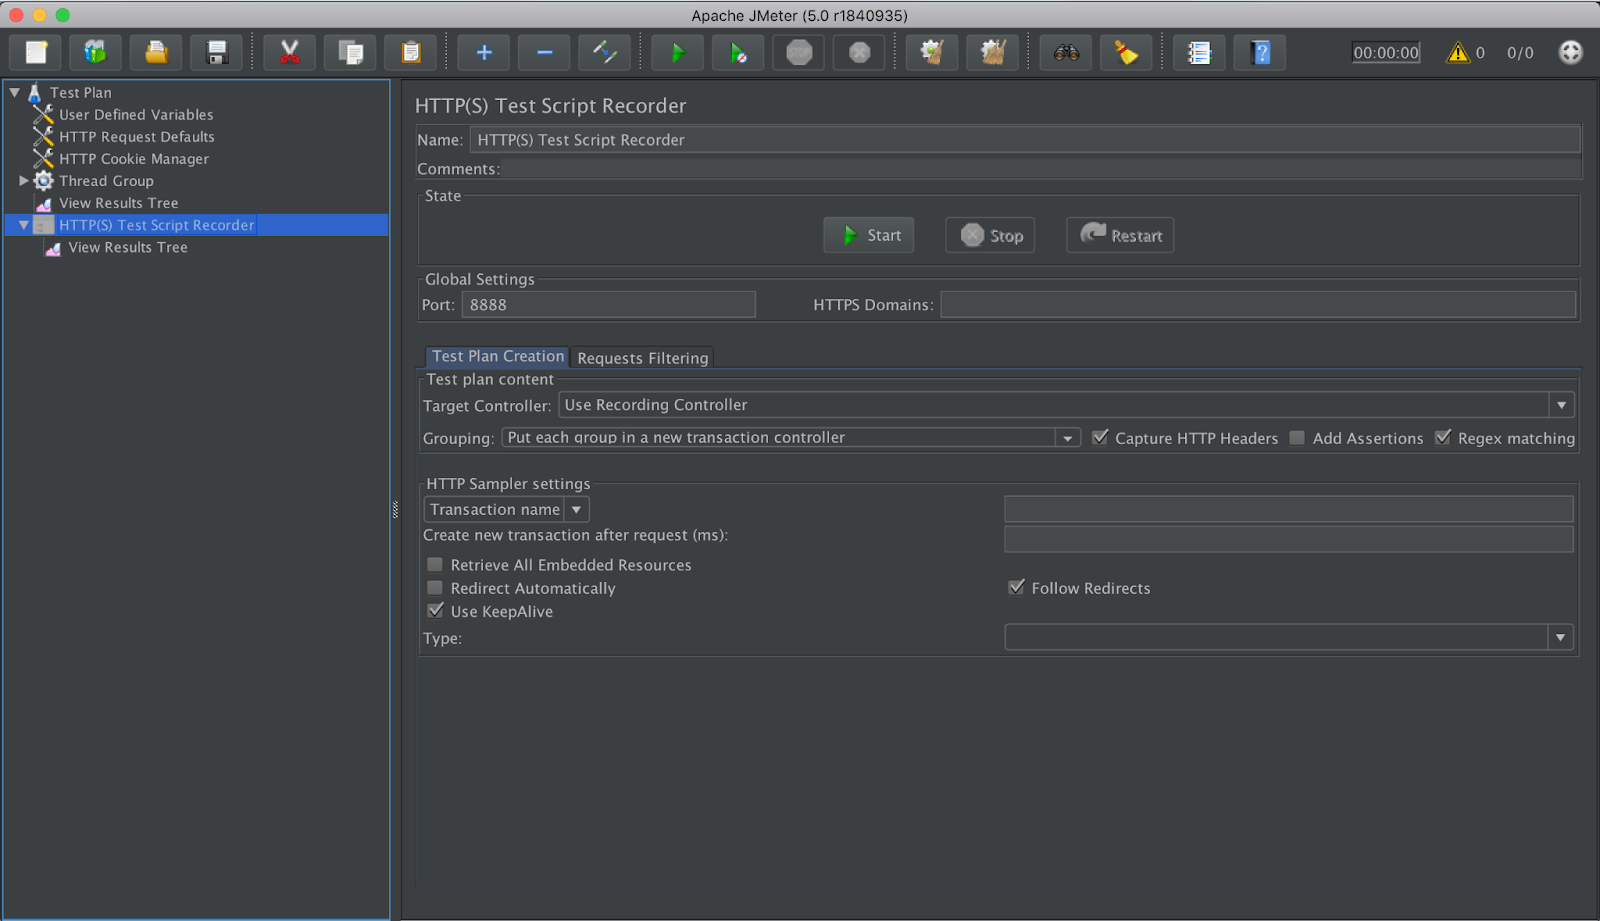
Tools like `Apache JMeter`, `LoadRunner`, and `Gatling` simulate user traffic to evaluate how systems perform under different loads. Load testing is crucial for ensuring applications can handle expected user activity without degradation in performance.
3. Monitoring Tools
Monitoring tools are crucial components of any IT infrastructure, providing real-time insights into system performance, security, website, and overall health. These tools collect data from various sources, such as servers, networks, applications, and databases, and present it in a unified dashboard for analysis. They let you proactively identify and address issues before they escalate, ensuring uninterrupted operations and optimal user experience.
From simple resource monitoring to complex event correlation and anomaly detection, monitoring tools empower organizations to maintain peak performance, enhance security posture, and meet service level agreements.
In addition to monitoring performance metrics, modern monitoring tools often incorporate advanced features such as predictive analytics, machine learning, and automation to anticipate and mitigate potential problems. They offer customizable alerting mechanisms to notify administrators of critical events or deviations from normal behavior, enabling swift remediation actions.
Furthermore, monitoring tools play a vital role in compliance management by providing audit trails and reports that demonstrate adherence to regulatory requirements. By leveraging these tools effectively, you can streamline operations, minimize downtime, and drive continuous improvement in your IT infrastructure.
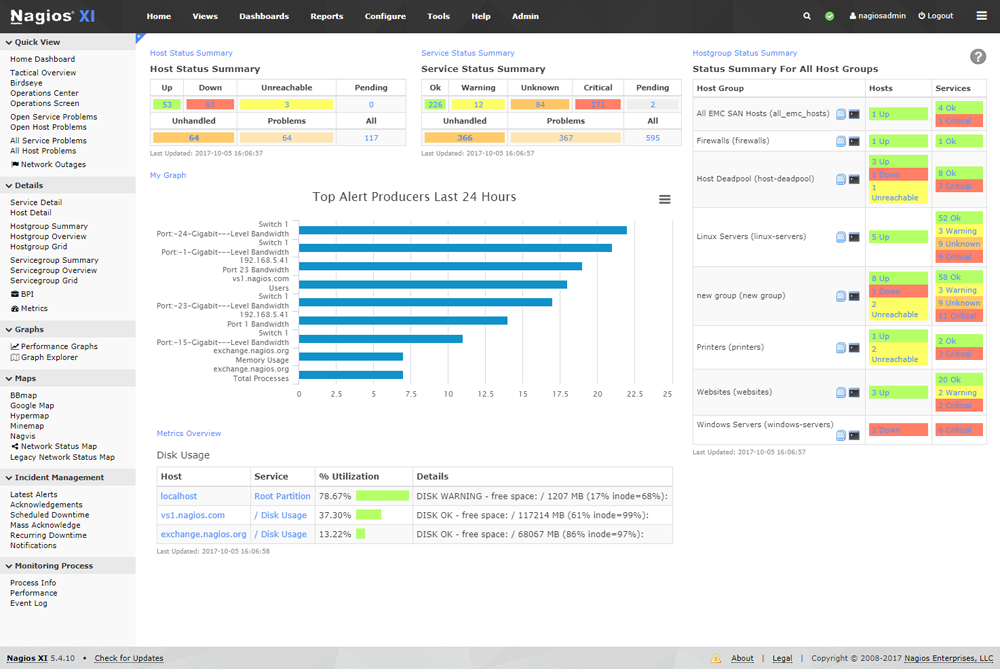
Monitoring solutions such as `Nagios`, `Prometheus`, and `Datadog` continuously track system metrics in real time. They alert you to potential issues and provide historical data for performance analysis and capacity planning.
4. Network Analysis Tools
Network analysis tools are indispensable for understanding the intricate web of connections that characterize online platforms, social media networks, and digital ecosystems. These tools enable you to scan vast datasets of user interactions, communication patterns, and information flows to uncover valuable insights.
These tools play a fundamental role in ensuring the security, efficiency, and effectiveness of digital systems by identifying the following:
- Influential nodes
- Communities within social networks
- Detecting patterns of cyber attacks
- Anomalies in network traffic
Furthermore, with the exponential growth of data generated by online activities, network analysis tools continue to evolve, leveraging advanced algorithms and techniques to provide deeper insights into the dynamics of digital networks and support decision-making processes in fields such as marketing, cybersecurity, and data science.
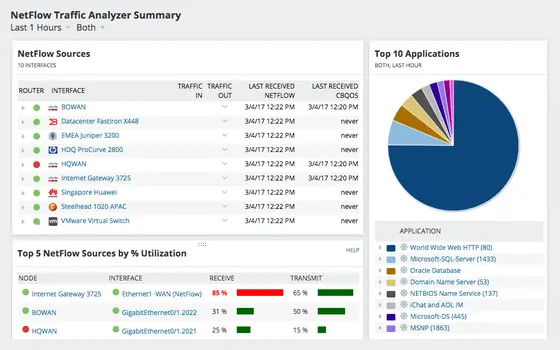
Tools like `SolarWinds`, `Paessler PRTG`, and `NetSpot` enable deep inspection of network traffic. They help diagnose network-related performance issues, identify bottlenecks, and optimize network configurations.
5. Web Performance Tools
Web performance tools are essential components in optimizing the responsiveness, speed, and overall performance of web applications and websites. These tools provide developers, designers, and website owners with insights into various performance metrics, including server response times, page load times, and correct resource utilization. By leveraging these tools, you can identify performance bottlenecks, optimize code, compress images, and implement caching strategies to augment user experience and drive higher engagement. Additionally, web performance tools offer features for monitoring the following:
- Website uptime
- Detecting broken links
- Analyzing user behavior
Furthermore, web performance tools often integrate with development workflows and content management systems, enabling automated testing, performance monitoring, and reporting. These integrations streamline the optimization process, allowing developers to identify performance issues early in the development stage and iterate quickly to deliver high-performance websites.
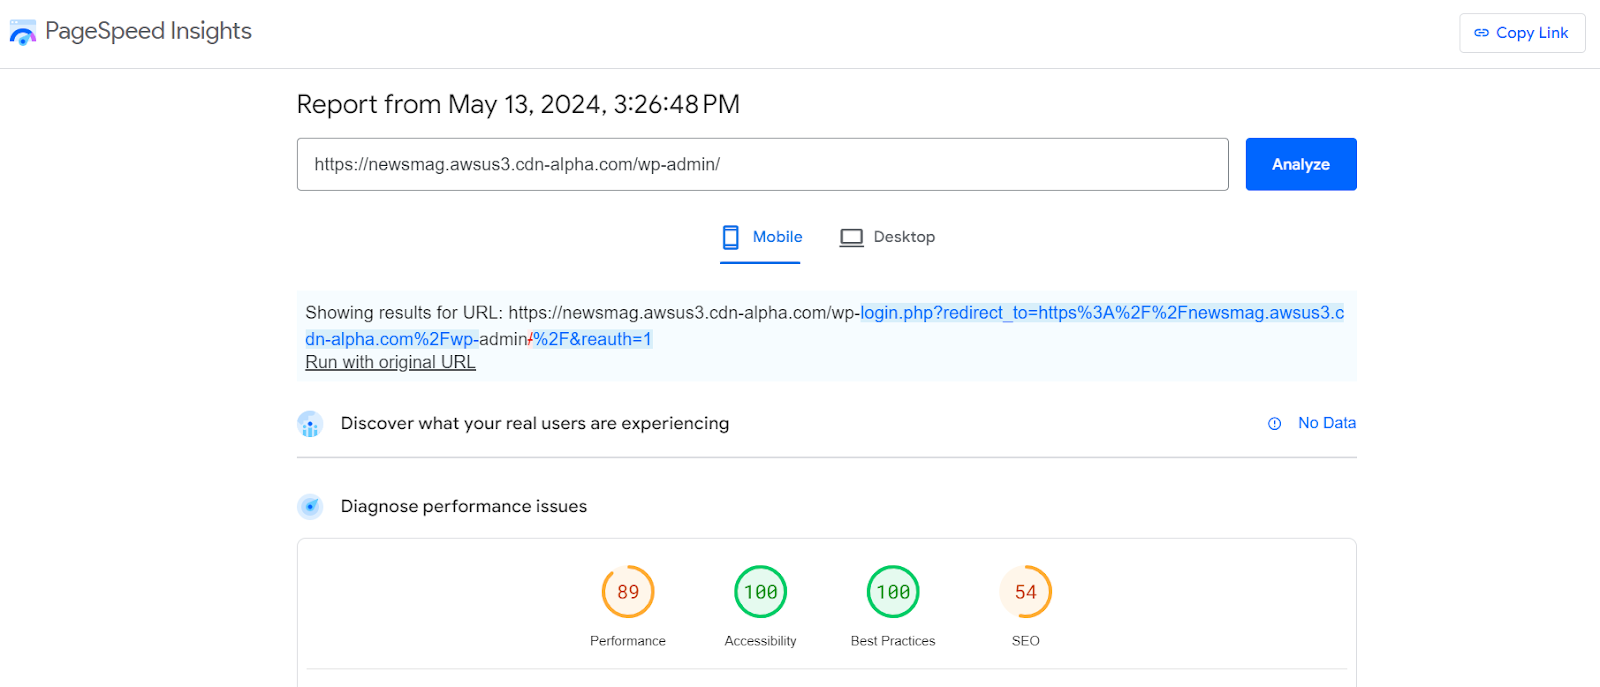
Tools like `Google PageSpeed Insights`, `GTmetrix`, and `WebPageTest` assess website performance by analyzing factors like page load time, render-blocking resources, and server response time. They offer recommendations for optimizing web performance and improving user experience.
6. Application Performance Management (APM) Tools
APM tools play a crucial role in modern software development practices, supporting DevOps and continuous delivery workflows. By integrating with development and deployment pipelines, APM tools enable automated performance testing, monitoring, and feedback loops, facilitating rapid iteration and delivery of high-quality software.
Additionally, APM tools often provide predictive analytics and anomaly detection capabilities, allowing organizations to proactively identify and address potential performance glitches before they impact end users.
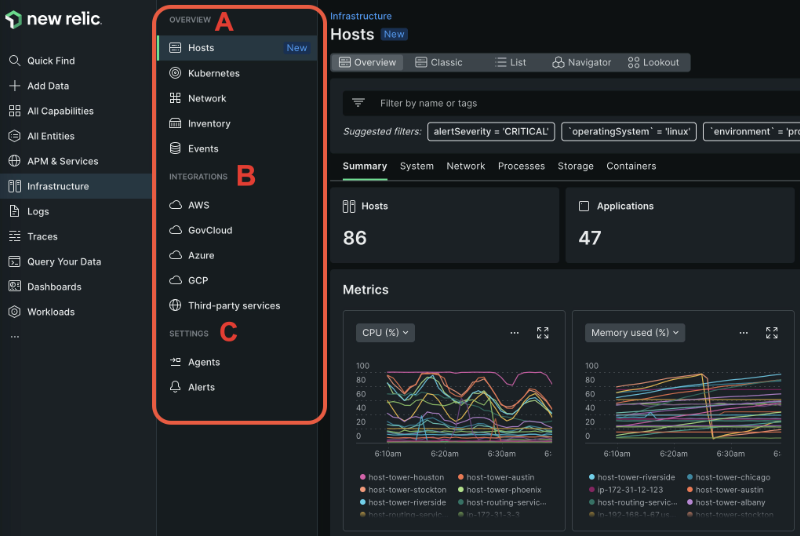
APM solutions like `New Relic`, `AppDynamics`, and `Dynatrace` provide end-to-end visibility into application performance. They monitor transactions, trace code execution, and correlate performance metrics with business transactions, helping organizations quickly identify and resolve performance issues.
Conclusion
In today’s hyper-connected world, performance analysis is not just a best practice; it’s a necessity. By incorporating the right tools and methodologies, organizations can ensure their systems, applications, and websites deliver optimal performance, enhancing user satisfaction and driving business success. Whether it’s about identifying code inefficiencies, stress-testing infrastructure, or monitoring real-time metrics, the arsenal of performance analysis tools empowers you to stay ahead in the digital race.
FAQs
What are the common methods used in performance analysis?
Common methods in performance analysis include quantitative analysis, qualitative analysis, trend analysis, benchmarking, and comparative analysis. These methods employ various tools and techniques to measure, evaluate, and interpret performance data.
What are some challenges associated with performance analysis?
Challenges in performance analysis may include data quality issues, lack of standardized metrics, complexity in interpretation, resistance to change, and ensuring the confidentiality and security of data. Overcoming these challenges requires a systematic approach, stakeholder engagement, and continuous learning and adaptation.
How often should performance analysis be conducted?
The frequency of performance analysis depends on the context and objectives of the analysis. It can be conducted periodically, such as monthly, quarterly, or annually, or in response to specific events or initiatives. Continuous performance analysis, integrated into regular operations, allows for timely adjustments and optimization.
