
I would like to ask you a question: How many browser DevTools panels do you typically use in your daily web development tasks? One, three, perhaps not much more. Have you ever explored the range of tools available within the DevTools toolbox? Chances are, you’re sticking to the same few panels repeatedly.
Surprisingly, there are over thirty individual panels in Chrome DevTools (and other Chromium-based browsers like Edge). Safari and Firefox offer fewer panels but still more than you likely utilize daily.
For web developers, it’s not crucial to memorize the precise names of every tool in DevTools. What matters most is understanding how to leverage these tools effectively when required. With DevTools packed with buttons, tabs, and features, it begs the question: How did we end up with such complexity, and is there a path toward simplification? Yes. Read on to find the path.
What are Chrome DevTools?
What are developer tools? These tools, often referred to as devtools, enable you to inspect, test, and debug code directly within a browser, impacting the user interface. Not only developers but marketers, SEO specialists, and designers can also utilize devtools to test modifications and enhance their web pages.
Before digging more into how to use Chrome DevTools, it’s essential to understand a few key points:
- HTML, CSS, and JavaScript operate within browsers, making them the three primary languages you’ll interact with using Chrome Developer Tools.
- Anyone can employ browser devtools to manipulate code, but these alterations only affect the user’s browser session and disappear upon page refresh.
- Browser devtools aid in identifying necessary changes, but to make them permanent, you must access and modify the code on the backend.
How to use Chrome DevTools?
1. To inspect a page, simply right-click on the webpage. Also, you can use the shortcut “Control+Shift+C” on Windows, Linux, and Chrome OS or “Command+Option+C” on Mac. Then, select “Inspect” from the menu that pops on the screen.
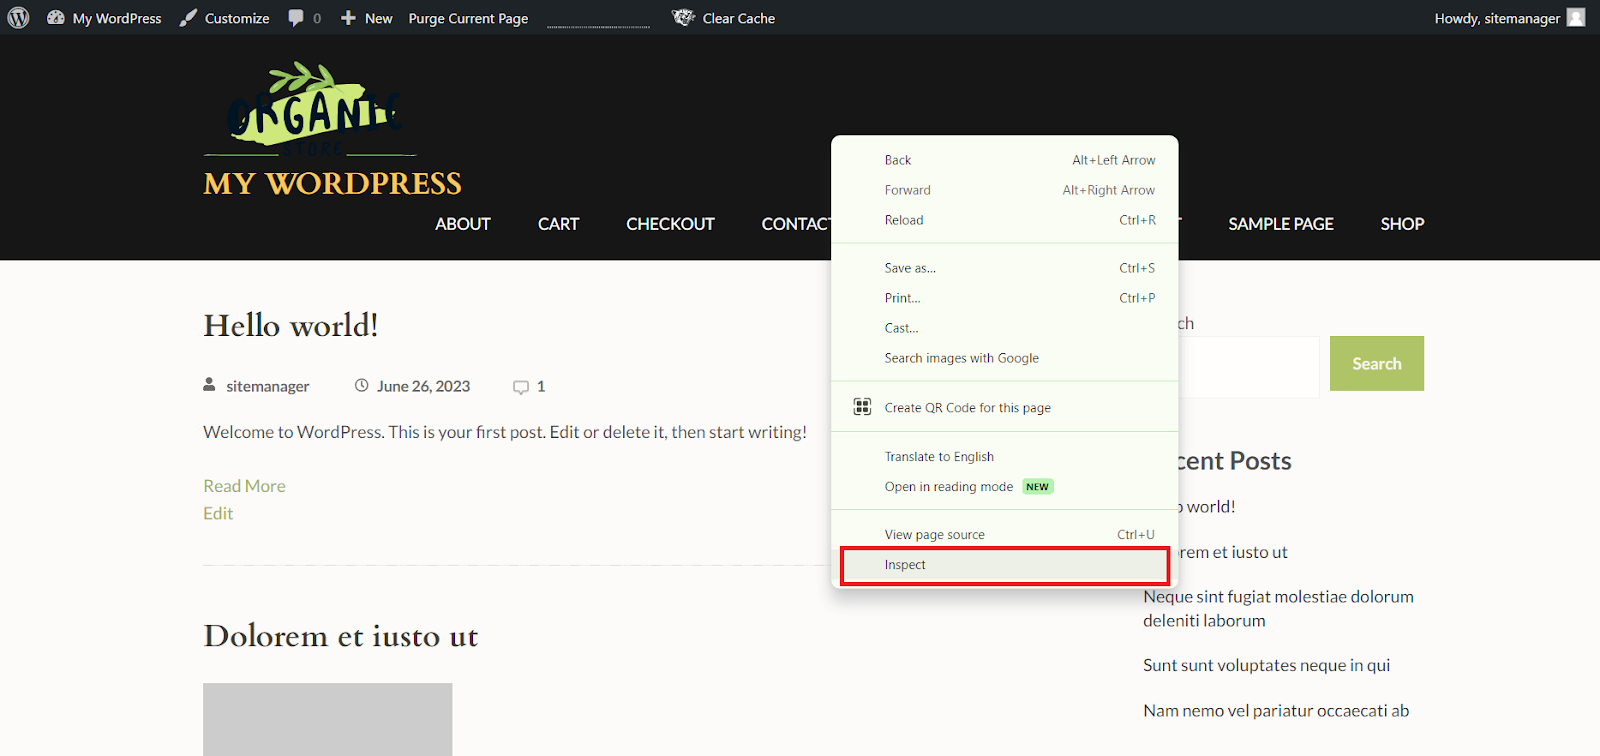
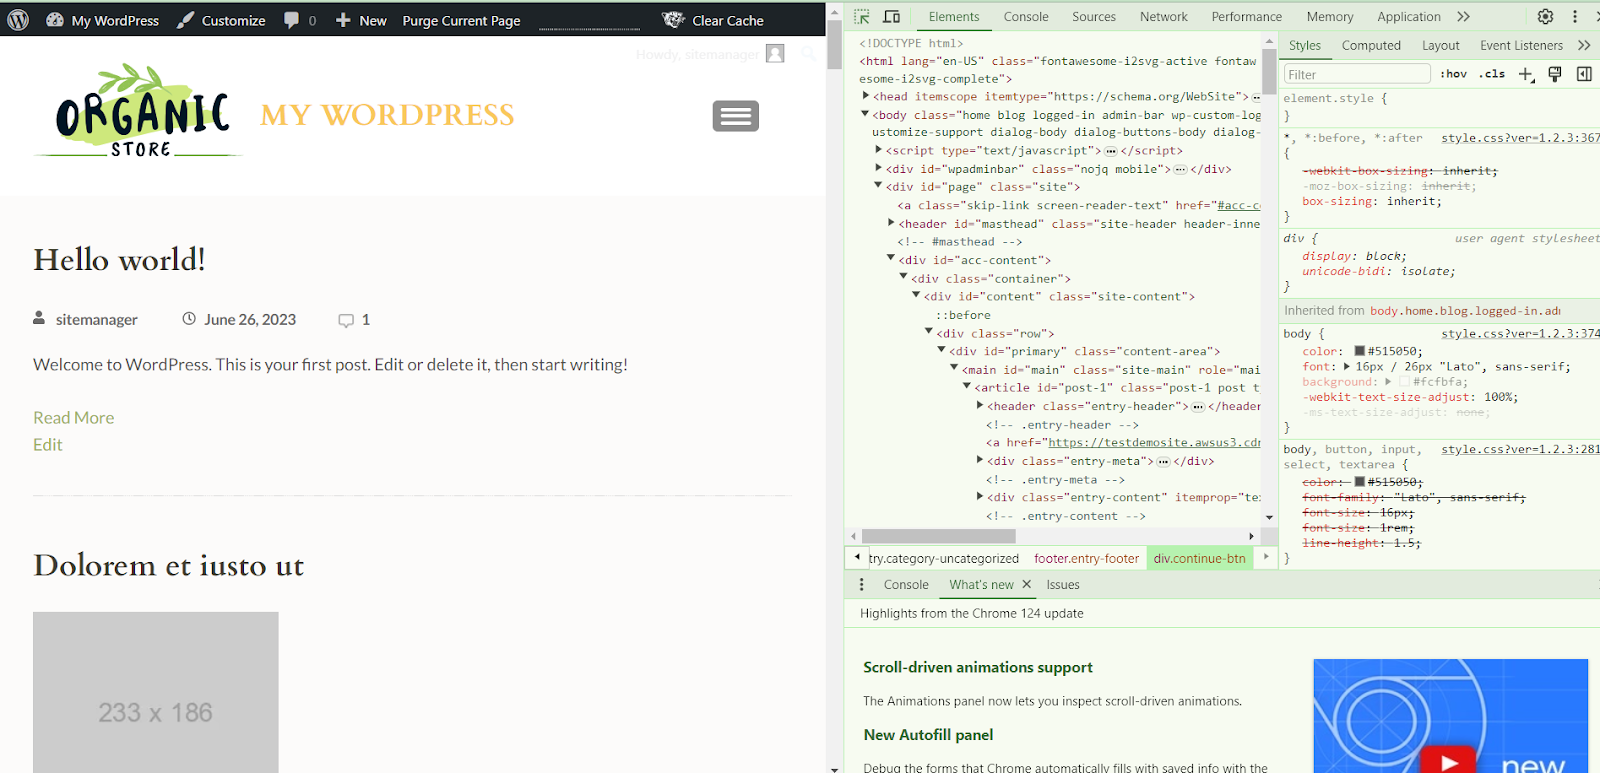
2. The Chrome DevTools window will then open, and you can navigate through each panel by clicking on the corresponding tab at the top of the screen.
3. Click on each tab to understand the tools. To close Chrome DevTools when you’re finished, simply click on the “X” symbol at the top right corner of the window.
The majority of web browsers offer their own developer toolkits, with many features overlapping. In Chrome DevTools, here are some of the key features:
– Device preview for testing responsive design
– JavaScript debugger for bug identification and fixing
– Network panel for tracking and analyzing page requests
– Inspector tool for making styling changes like font, spacing, colors, and margins
– Console for identifying page errors and warnings
– Performance panel for checking website performance metrics such as page speed
How to check the responsiveness of the design?
The Toggle Device Toolbar within Chrome DevTools enables you to preview how your webpage appears on various devices, including iPhone models, iPads, and laptops. You can even input custom dimensions if a specific device isn’t listed.

During initial web development or redesign phases, this toolbar aids in visualizing how your page renders across different screen sizes. It’s particularly valuable for assessing user experience, such as identifying issues like lengthy paragraphs that may hinder readability on mobile devices compared to desktops.
For instance, if data reveals that mobile users spend less time on your blog posts than desktop users, examining the page on both devices may reveal readability issues on mobile due to overly long paragraphs. Adjustments like shorter paragraphs and more visuals can enhance the mobile user experience.
Moreover, this toolbar allows you to simulate slower connections to assess how users with limited bandwidth experience page loading. “No throttling” mode reflects uninterrupted connection, while slower connections may delay loading, and offline mode displays a “no internet” error code.
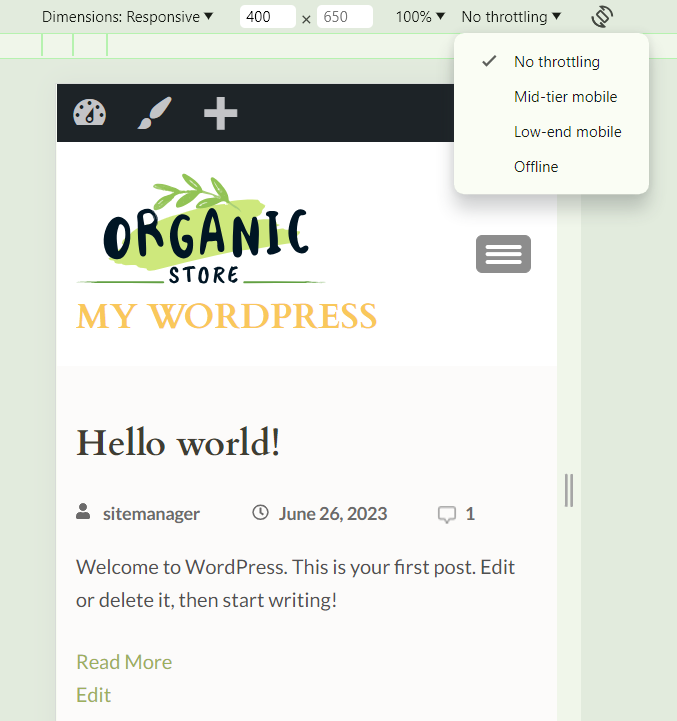
This functionality proves valuable for ensuring a positive user experience across various connection speeds, helping identify areas for optimization in page loading performance.
Also Read: Learn Best Mobile Usability Practice and Top 5 Mobile Performance Testing Tools in 2024
How to check the speed of the website?
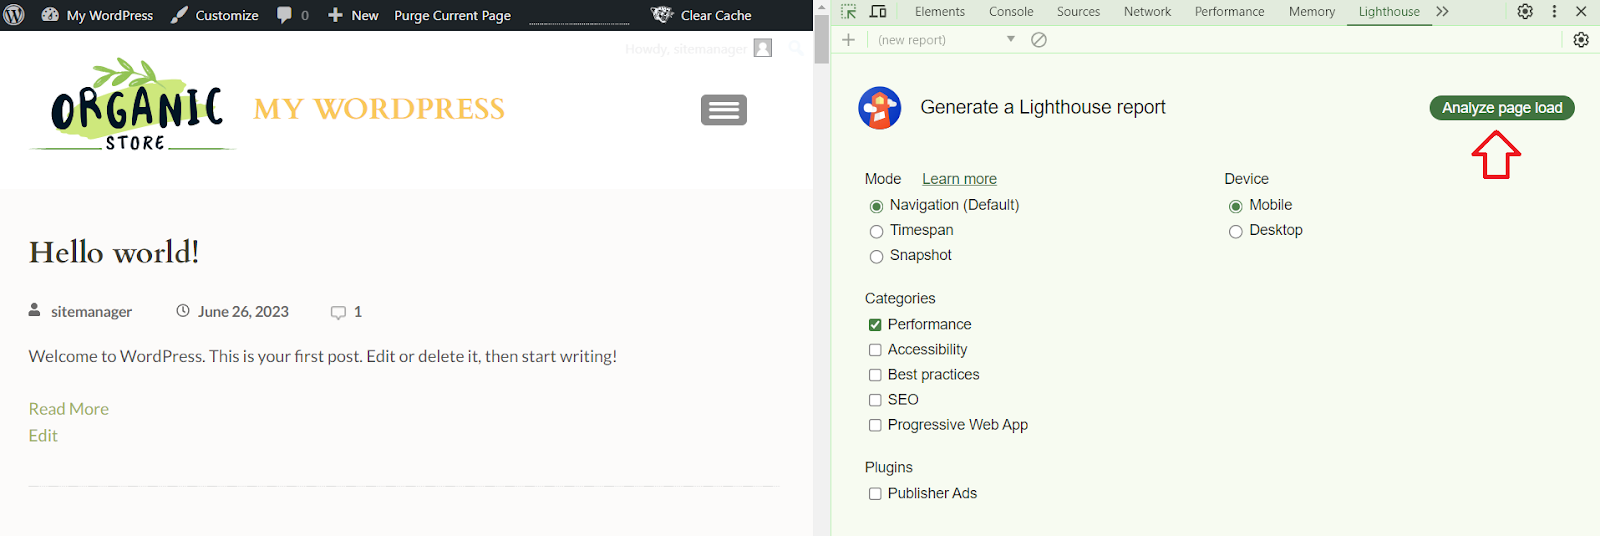
Assess and enhance your website’s speed using Lighthouse, an open-source Google tool that evaluates webpage performance and suggests areas for improvement. You can utilize it within Chrome DevTools to analyze everything from site speed and SEO to accessibility across both mobile and desktop platforms.
Page speed significantly influences your website’s ranking and should be a primary focus during SEO audits. To evaluate your page speed with Lighthouse, access the “Performance” tab and select the desired device for testing. Then, click “Analyze Page Load” to view the results, paying particular attention to the “Speed Index.”
A good or fast speed index typically falls between 0 and 4.3 seconds, while a moderate range is between 4.4 and 5.8 seconds. Speed indexes exceeding 5.8 seconds indicate slower loading times, necessitating optimizations to enhance page speed.
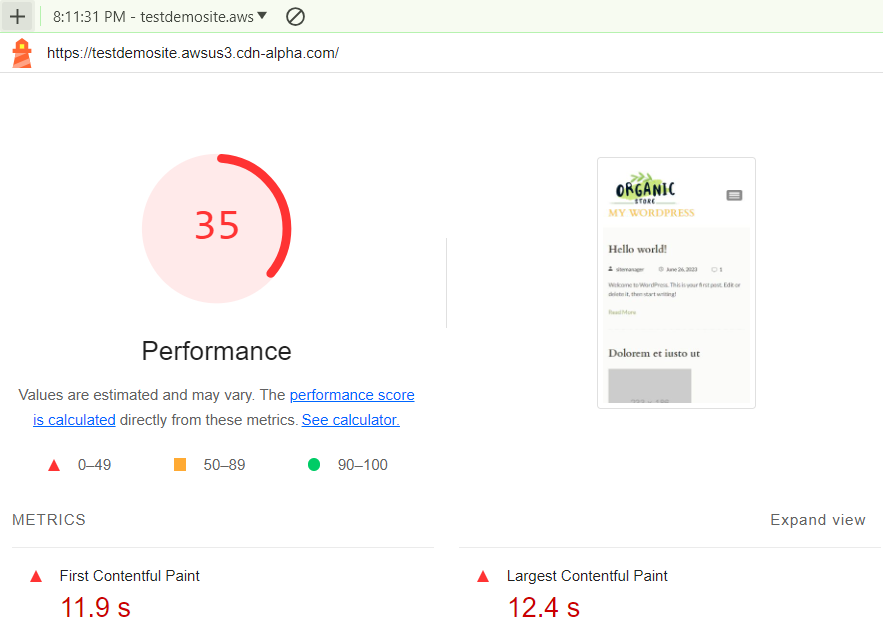
Another crucial section to review is “Opportunities,” which provides suggestions for reducing page load speed. In addition to impacting SEO, slow page speed can contribute to high bounce rates. Utilizing the Lighthouse tool is an effective starting point for optimizing page loading times and improving overall website performance.
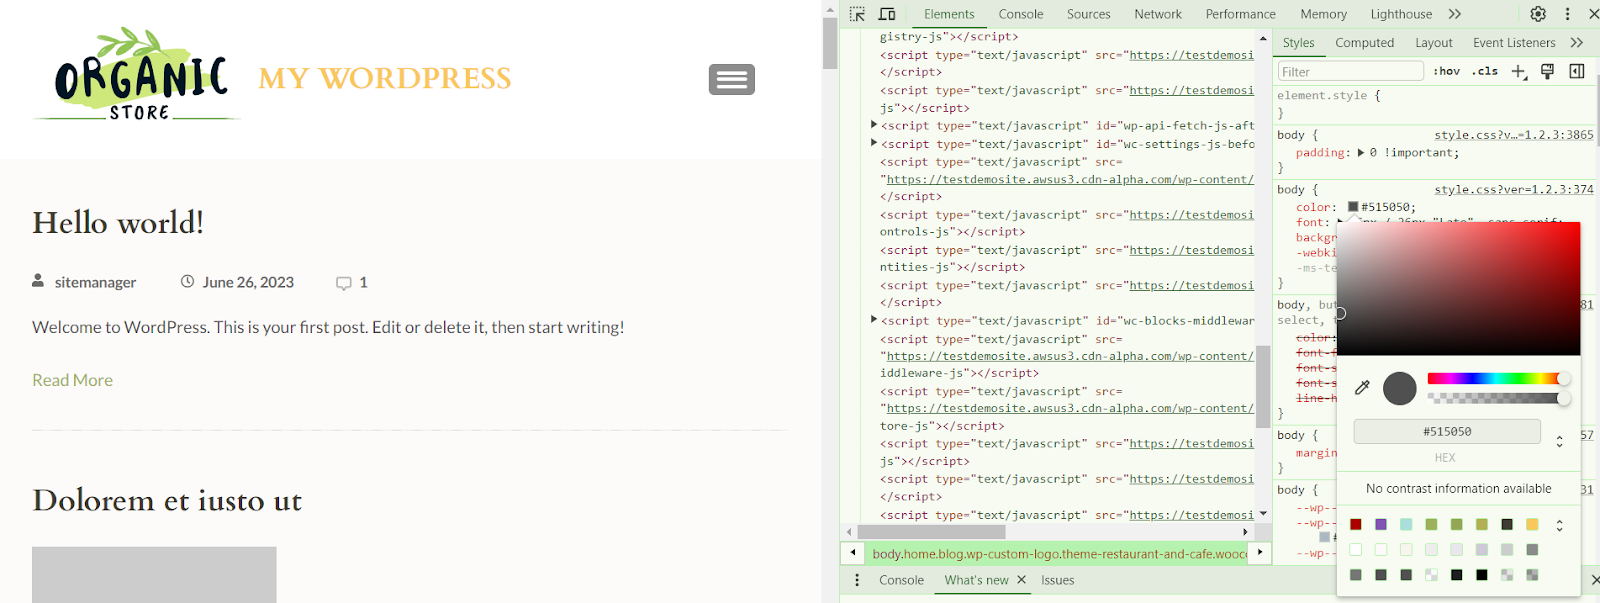
How to change the style of design on a website?
To modify styling, choose the element you wish to edit. This action will prompt the “Elements” panel to navigate to the HTML and CSS code corresponding to that element. Direct your attention to the “Styles” tab for the relevant styling options.
How to check the SEO of the website?
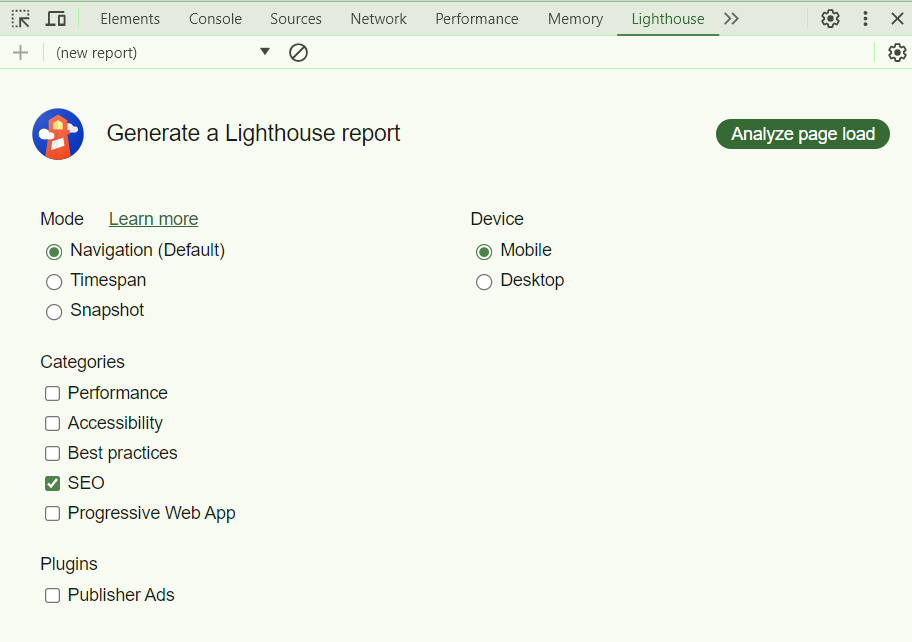
Every brand strives to rank highly on search engines to expand its reach and attract more website traffic. To maintain a strong position, it is essential to conduct regular audits to identify any factors that could potentially lower your page’s ranking. With Chrome DevTools, you can utilize Lighthouse to perform an audit and assess elements impacting your ranking.
To begin, navigate to the Lighthouse tab and select “SEO” under categories, along with the preferred device for analysis. Then, click “Analyze Page Load.”
The generated report will highlight successful audits and opportunities for improvement, providing valuable insights into your site’s SEO performance.
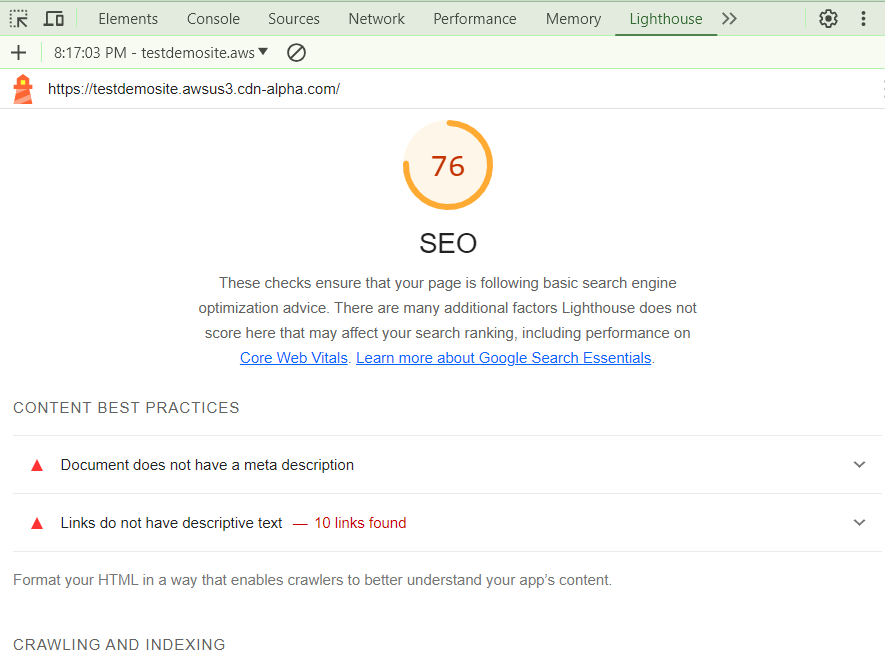
While this SEO audit may not cover every aspect comprehensively, it serves as a useful starting point for gaining a quick overview of your site’s SEO health.
Bottom Line
Chrome Developer Tools can be straightforward to use once you become familiar with its layout and functionalities. While having some coding knowledge can certainly enhance your experience and understanding of the tool, it’s not a prerequisite for achieving success with it. The user interface is developed to be intuitive, allowing users to navigate through panels and access various features without needing an extensive coding background.
Additionally, many tasks within DevTools, such as inspecting elements, debugging JavaScript, and analyzing network activity, can be accomplished with minimal coding expertise. Overall, while coding knowledge can be beneficial, Chrome Developer Tools are accessible to users with varying levels of technical proficiency.
FAQs
Is Chrome DevTools only available in Google Chrome?
While Chrome DevTools is primarily designed for the Google Chrome browser, similar developer tools are available in other browsers like Mozilla Firefox (Firefox Developer Tools) and Microsoft Edge (Edge DevTools). However, the features and interface may vary slightly between browsers.
How can I analyze network activity using Chrome DevTools?
Chrome DevTools includes a “Network” panel that displays detailed information about all network requests made by a webpage, including HTTP requests, response headers, and request timings. This panel can help you identify slow-loading resources, optimize page load times, and troubleshoot network-related issues.
Can Chrome DevTools help with debugging JavaScript code?
Yes, Chrome DevTools includes a powerful JavaScript debugger that permits you to set breakpoints, inspect variables, and step through code execution to identify and fix bugs in your JavaScript code. This feature is invaluable for troubleshooting errors and improving the functionality of your website.
