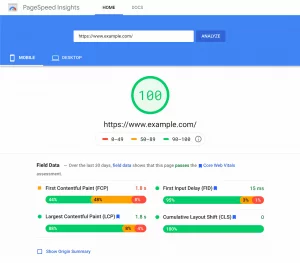
In today’s digital age, where online competition is fiercer than ever, understanding user behavior is the key to unlocking success. As businesses strive to create engaging websites and applications, they are increasingly turning to heatmap tools for valuable insights into user interactions. The numbers speak for themselves: according to recent studies, websites that utilize heatmap tools experience an average increase in conversion rates by 10% to 15%. Furthermore, research indicates that businesses that optimize their websites based on heatmap analysis see a significant improvement in user engagement metrics, with bounce rates decreasing by up to 25% and average session durations increasing by 20% on average.
These statistics underscore the importance of heatmap tools in today’s digital landscape. By providing a visual representation of user behavior, heatmap tools offer businesses a deeper understanding of how visitors interact with their online platforms.
What is a heatmap tool?
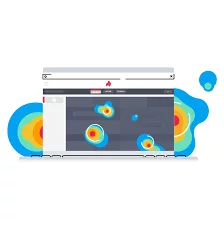
A heatmap is a powerful tool for visualizing and understanding how visitors interact with a website. It provides an overlay on top of web pages, using color gradients to represent user activity levels. Areas with higher user engagement are depicted as “hotter” spots, while areas with less activity appear “cooler.”
Unlike traditional analytics tools like Google Analytics, which focus on metrics such as traffic sources and page views, heatmap tools offer insights into user behavior within the website’s design itself. By tracking clicks, scrolling behavior, and mouse movements, heatmap analytics provide valuable data on how users navigate and engage with different elements of a webpage.
There are three main types of heatmaps:
- Click Map: This type of heatmap visualizes where users click on a webpage and how frequently they interact with specific elements. Click maps highlight areas of high user engagement, helping website owners identify popular features or areas of interest.
- Scroll Map: Scroll maps indicate how far users scroll down a webpage and what percentage of visitors reach different sections. By analyzing scroll behavior, website owners can determine if important content or calls-to-action are being overlooked and make adjustments to improve visibility and engagement.
- Mouse Movement Map: Mouse movement maps track the path of users’ cursors as they navigate a webpage. This data reveals areas of interest or attention, providing insights into user preferences and behavior patterns. For example, areas where users hover their mouse cursor may indicate points of interest or hesitation, informing decisions on page layout and content placement.
Benefits of Heatmap Tools:
- Visual Representation of User Behavior: Heatmap tools visually represent user interactions on a website or application, making it easy to identify patterns and trends in user behavior. This visual representation helps in understanding how users engage with different elements on a webpage, such as buttons, links, and images.
- Identifying Hotspots and Coldspots: Heatmaps highlight areas of high activity (hotspots) and low activity (coldspots) on a webpage, providing insights into which areas attract the most attention from users and which areas may need improvement or optimization.
- User Experience Optimization: By analyzing heatmap data, businesses can gain valuable insights into user experience (UX) issues such as confusing navigation, ineffective calls-to-action, or poorly positioned content. This information enables website owners to make data-driven decisions to optimize the UX and improve overall user satisfaction.
- Conversion Rate Optimization (CRO): Heatmap tools help identify barriers to conversion by showing where users click, how far they scroll, and where they drop off. This information enables businesses to optimize conversion paths, streamline the checkout process, and improve the effectiveness of lead generation forms, ultimately leading to higher conversion rates.
- Content Placement and Design Optimization: Heatmap analysis provides insights into which types of content (text, images, videos) users engage with the most and how they interact with different design elements. This information can inform decisions related to content placement, layout design, and visual hierarchy, ensuring that key messages and calls-to-action are prominently displayed and effectively communicated to users.
- Responsive Design Testing: Heat map tools often include features for testing website responsiveness across various devices and screen sizes. By analyzing heatmap data from different devices, businesses can ensure that their websites provide a consistent and optimized user experience across desktops, laptops, tablets, and smartphones.
- A/B Testing and Iterative Improvements: Heatmap tools often integrate with A/B testing platforms, allowing businesses to test different design elements, layouts, and content variations to determine which performs best in terms of user engagement and conversion metrics. This iterative approach to optimization enables continuous improvement based on real user feedback and behavior.
- Data-Driven Decision Making: Overall, heat map tools empower businesses to make data-driven decisions by providing actionable insights into user behavior and website performance. By leveraging this data, businesses can optimize their digital assets to better meet the needs and preferences of their target audience, leading to improved ROI and business success.
Here is your introductory guide to heatmaps.
Top Heat Map Tools of 2024:
1. Microsoft Clarity
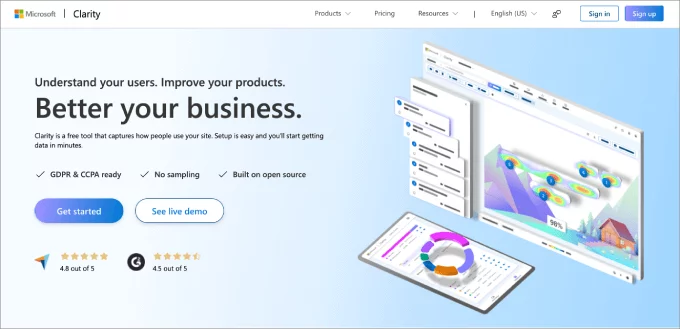
Microsoft Clarity is a comprehensive analytics tool designed to enhance your understanding of the user engagement on your website. With features such as heatmaps, scroll tracking, and click tracking, Clarity provides valuable insights into how visitors interact with your site.
Upon installation, Clarity automatically begins tracking each user session, allowing you to access detailed statistics directly from your dashboard. In addition to standard analytics, Clarity offers unique metrics such as Quickbacks, which identify buttons that users may be clicking by mistake, and excessive scrolling detection, which helps pinpoint low-performance pages. Furthermore, the scroll depth percentage feature provides insights into user behavior by indicating which pages are viewed entirely to the bottom.
Clarity seamlessly integrates with Google Analytics, streamlining your analytics process by eliminating the need to switch between platforms. For WordPress users, Clarity offers easy installation and integration, making it a convenient choice for website optimization.
Pros:
- Covers essential features for understanding website performance.
- Completely free to use.
- Provides useful UX metrics like dead clicks and rage clicks.
Cons:
- Lacks A/B testing and eCommerce tracking capabilities.
- Has a steeper learning curve compared to paid platforms.
Why we recommend using Microsoft Clarity: Microsoft Clarity offers robust analytics capabilities at no cost, making it an excellent option for website owners seeking valuable insights into user behavior. With user-friendly features and seamless integration with WordPress, Clarity is a practical choice for optimizing website performance.
2. Crazy Egg
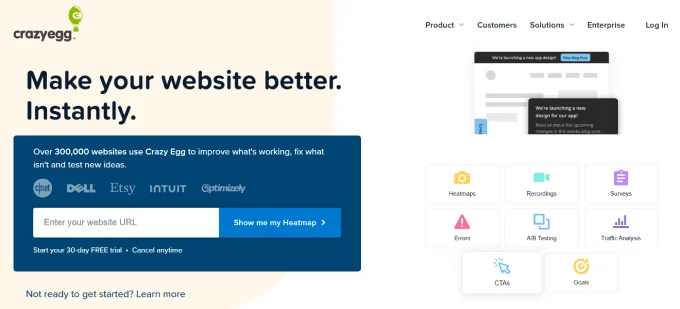
Crazy Egg stands out as a top-notch WordPress heatmap plugin, offering a range of features to analyze user engagement effectively. Alongside click, mouse cursor, and scroll heatmaps, Crazy Egg provides a unique confetti heatmap feature, allowing you to segment heatmap data by traffic sources for deeper insights.
In addition to heatmap analysis, Crazy Egg enables user activity recording, enabling you to observe how visitors navigate your website and identify usage patterns. The platform also tracks errors such as page bounces, rage clicks, and dead clicks, empowering you to address issues that may impact user experience promptly.
With a range of pricing plans starting at $29 per month, Crazy Egg offers flexibility to accommodate various website needs. Plus, all plans include a one-month free trial and support unlimited websites, making it suitable for multisite owners.
Pros:
- Offers comprehensive insights into user behavior, including total errors and interaction patterns.
- Provides overlay reports for a detailed breakdown of click distribution across web pages.
- Known for its user-friendly interface and ease of use.
- Supports A/B testing and page variations to optimize website performance.
Cons:
- Does not offer a free plan.
Why we recommend using Crazy Egg: Crazy Egg is a feature-rich heatmap tool equipped with advanced analytics capabilities. With heatmap, scrollmap, and confetti reports, along with A/B testing functionality, Crazy Egg empowers website owners to make data-driven decisions, enhancing user experience and conversion rates.
3. Mouseflow

Mouseflow is a user-friendly heatmap tool designed to provide valuable insights for WordPress users. With features such as click heatmaps, scroll tracking, mouse movement tracking, and attention heatmaps, Mouseflow offers a comprehensive analysis of user behavior on your website.
In addition to heatmap analysis, Mouseflow enables the recording of website visitor activity, allowing you to observe user interactions in real-time. One notable feature offered by Mouseflow is form analytics, which helps identify reasons for form abandonment, enabling you to optimize form design and increase conversions.
Moreover, Mouseflow allows you to track funnels and set up custom funnels to analyze user behavior from different traffic sources. With a dedicated WordPress plugin, integrating Mouseflow with your site is seamless and hassle-free.
Mouseflow offers a free plan with limited features, including 100 recorded sessions for a single site. Paid plans start at $31 per month, offering 5,000 recorded sessions for one website, with pricing increasing based on the number of recorded sessions and websites.
Pros:
- Provides geo heatmaps to identify active user locations and optimize marketing campaigns.
- Offers session replay functionality to pinpoint areas of user frustration or difficulty.
- Tracks click, scroll, and movement interactions for comprehensive website analysis.
Cons:
- All user session replays are stored in a single folder, potentially making organization challenging.
Why we recommend using Mouseflow: Mouseflow offers valuable insights into user behavior, including geographic data and session replays, to help optimize website performance. With intuitive features and easy integration with WordPress, Mouseflow is a practical choice for enhancing user experience and driving conversions.
4. Lucky Orange

Lucky Orange is a popular heatmap analytics tool known for its comprehensive feature set. Offering heatmap tracking for clicks, mouse movement, and scroll depth, Lucky Orange provides detailed insights into user engagement on your website.
In addition to heatmap analysis, Lucky Orange offers session recording and traffic segmentation capabilities, enabling you to observe user behavior and identify trends. The platform also includes features such as form analytics, conversion funnels, visitor polls, and live chat software to enhance user interaction and engagement.
Installing Lucky Orange on your WordPress website is straightforward, with a plugin available for seamless integration. With pricing plans starting at $32 per month and a free 7-day trial, Lucky Orange offers flexibility and affordability for website owners.
Pros:
- Dynamic heatmaps capture real-time data for pop-ups, dropdowns, and carousels.
- Advanced filtering options allow for detailed data analysis, including events, dates, sources, and visited pages.
- Offers multiple on-page survey options and live chat functionality for improved user engagement.
Cons:
- Limited to a maximum of 60 days of data storage.
- Dashboard customization options are limited.
Why we recommend using Lucky Orange: Lucky Orange stands out for its dynamic heatmap capabilities and extensive feature set, including A/B testing and live chat functionality. With robust analytics tools and intuitive usability, Lucky Orange is an ideal choice for website owners seeking comprehensive insights into user behavior.
5. Inspectlet

Inspectlet is a powerful session recording and heatmap service designed to provide an in-depth analysis of user interactions on your website. Offering click, cursor movement, and scrolling heatmaps, Inspectlet delivers comprehensive insights into user engagement and behavior.
One notable feature of Inspectlet is its robust filtering capabilities, allowing you to segment session replays based on various criteria, such as new visitors vs. returning visitors. Additionally, Inspectlet offers form analytics to optimize lead generation and conversion funnels for tracking user journeys.
While Inspectlet’s user interface may be clunky, its advanced analytics features make it a valuable tool for website optimization and performance enhancement.
Pros:
- Tracks mouse clicks, movements, and scrolls for detailed website analysis.
- Offers powerful filtering options for segmenting session replays and analyzing user behavior.
- Allows tagging of users and sessions for easy reporting and replay identification.
Cons:
- User interface may be challenging to navigate.
- Limited customization options for dashboards.
Why we recommend using Inspectlet: Despite its user interface limitations, Inspectlet offers advanced analytics capabilities, including detailed funnel tracking and user segmentation. With comprehensive heatmap analysis and session recording features, Inspectlet is a valuable tool for optimizing website performance and enhancing user experience.
6. Zoho PageSense
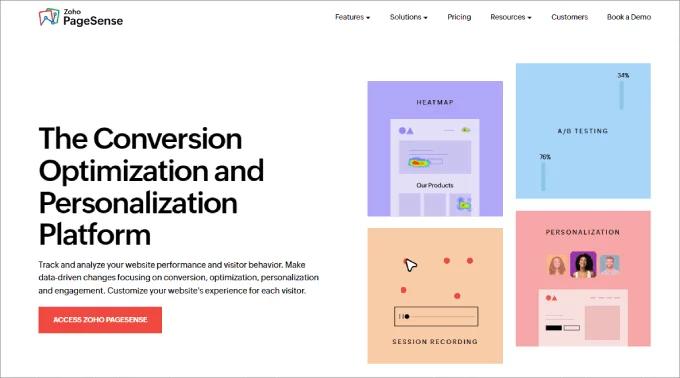
Zoho PageSense is a versatile conversion optimization platform that rivals competitors such as Crazy Egg and Hotjar. Offering features such as heatmaps, session recordings, form analytics, and A/B testing, Zoho PageSense offers comprehensive insights into user behavior and website performance.
One standout feature of Zoho PageSense is its content personalization functionality, allowing you to customize website elements based on user attributes such as location, behavior, and device. Additionally, Zoho PageSense offers push notifications to re-engage visitors and drill-down analytics to analyze traffic sources and visitor behavior.
While Zoho PageSense may have a steeper learning curve compared to other platforms, its robust feature set and affordable pricing make it a compelling choice for website optimization.
Pros:
- Tracks dynamic web elements for detailed data analysis.
- Offers push notifications to re-engage visitors and drive conversions.
- Provides detailed analytics on traffic sources, visitor behavior, and page performance.
Cons:
- Learning curve is higher compared to other platforms.
- Limited dashboard customization options.
Why we recommend using Zoho PageSense: Zoho PageSense offers a comprehensive suite of conversion optimization tools, including heatmaps, A/B testing, and content personalization. With its versatile features and affordable pricing, Zoho PageSense is an ideal choice for website owners seeking to improve user experience and drive conversions.
7. Heatmap.com
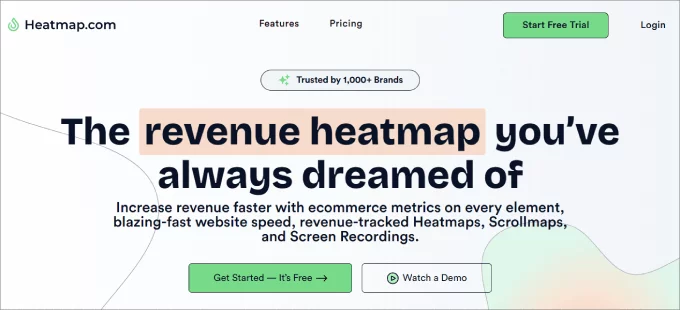
Heatmap.com is renowned for its user-friendly interface, making it one of the simplest heatmap analytics tools available. Its installation process is hassle-free, utilizing a small JavaScript code that loads asynchronously, ensuring minimal impact on website performance.
What sets Heatmap.com apart is its unique capability to display the revenue generated by every click on every element of your site. This invaluable feature allows the analysis of the effectiveness of specific elements, such as hero buttons, by tracking revenue amounts, average conversion rates, and average order values associated with each click. Moreover, Heatmap.com offers real-time heat maps, providing live insights into user interactions, a feature not commonly found in other tools. Additionally, it prioritizes user privacy by abstaining from logging unnecessary data.
Price: Heatmap.com offers a free plan limited to 5 pages on 1 site. Paid plans start at $89 per month, providing access to revenue-based heatmaps, scrollmaps, and screen recordings.
Pros:
- Offers comprehensive data-driven analytics, including revenue and conversion rate insights tied to specific elements.
- Minimal impact on website speed.
- 7-day free trial available.
Cons:
- Relatively higher cost compared to some competitors.
Why we recommend using Heatmap.com: Heatmap.com stands out for its ability to provide revenue-focused insights, offering a deeper understanding of website performance beyond mere click numbers. With real-time heat maps and extensive analytics capabilities, Heatmap.com is an invaluable tool for optimizing conversions and maximizing sales.
8. Smartlook

Smartlook is a comprehensive analytics tool designed to provide deep insights into user behavior on the website. Offering features such as heatmaps, session recordings, events tracking, and funnel analysis, Smartlook equips you with the tools needed to understand and optimize the user experience.
One of Smartlook’s standout features is its funnel analysis capability, allowing you to visualize user journeys and identify areas for improvement. By tracking user interactions at each stage of the funnel, you can pinpoint drop-off points and optimize the conversion process effectively.
Smartlook also offers robust filtering options, enabling you to segment the users based on various criteria like location, browser, and referral URL. Additionally, its session replay recordings library is well-organized, making it easy to search and analyze user sessions.
Price: Smartlook offers a free plan with limited features, including 3,000 monthly sessions. Paid plans start at $55 per month, offering advanced analytics features such as event tracking and funnel analysis.
Pros:
- Comprehensive filtering options for in-depth user segmentation.
- Well-organized session replay recordings library with search functionality.
- Heatmaps available for mobile apps as well.
Cons:
- Lack of A/B testing functionality.
Why we recommend using Smartlook: Smartlook offers a comprehensive suite of analytics tools, including heatmaps, session recordings, and funnel analysis, making it ideal for understanding and optimizing the user experience. With its intuitive interface and extensive filtering options, Smartlook is a valuable tool for reducing drop-offs and driving conversions.
How to Choose the Best Heatmap Tool
When selecting a heatmap tool for your WordPress site, it’s crucial to consider various factors to ensure it meets your needs effectively. Here are key criteria to evaluate different solutions:
1. Ease of Use:
- Look for a heatmap tool with a user-friendly interface and straightforward setup process.
- Ensure it offers codeless script installation, eliminating the need for manual HTML code insertion.
- Heatmap creation, data access, and report viewing should be intuitive for users of all technical skill levels.
2. Supports Browsable Heatmaps:
- Opt for a tool that allows browsing behind logins, enabling interaction with pages within restricted areas like membership portals.
- This feature is invaluable for understanding user behavior in protected sections of your site, such as paid membership content or checkout processes.
3. Tracks Behavior on the Element Level:
- Choose a heatmap tool capable of tracking user interactions at the element level, including buttons, links, and images.
- Ensure it can adapt to responsive designs, capturing interactions across various screen sizes and resolutions.
- Look for the ability to record interactions with hidden elements like collapsible navigation bars or dropdown menus.
4. Highly Customizable:
- Prioritize a tool that offers high levels of customization to fit your specific needs.
- Look for features that allow you to export heatmap data based on specific time periods or filter data for individual devices.
- The ability to customize parameters ensures the heatmap tracks relevant metrics tailored to your objectives.
Conclusion:
Heatmap tools are invaluable resources for businesses and website owners seeking to understand user behavior and optimize their digital assets. From identifying popular areas on a webpage to uncovering usability issues, heatmap analysis can inform decision-making processes aimed at improving user experience, conversion rates, and overall performance. Additionally, heatmap tools often offer supplementary features like session recording, A/B testing, and segmentation capabilities, further enhancing their utility for businesses of all sizes. By leveraging heatmap tools effectively, organizations can gain a competitive edge in the digital landscape by making data-driven optimizations that resonate with their target audience.
FAQs on Heatmap Tools:
Are heatmap tools suitable for all types of websites?
Yes, heatmap tools can be beneficial for a wide range of websites, including e-commerce platforms, blogs, corporate websites, and SaaS applications. Any website or application seeking to improve user experience, optimize conversion rates, or understand user behavior can benefit from heatmap analysis.
Are heatmap tools privacy-compliant?
Most reputable heatmap tools prioritize user privacy and adhere to data protection regulations such as GDPR and CCPA. They typically anonymize and aggregate user data to ensure individual privacy while still providing valuable insights to website owners.
Can heatmap tools integrate with other analytics platforms?
Yes, many heatmap tools offer integrations with popular analytics platforms such as Google Analytics, Adobe Analytics, and Mixpanel. This integration allows businesses to correlate heatmap data with other metrics and gain a comprehensive understanding of user behavior across different channels.


