
Frontend monitoring isn’t just an option today; it’s crucial for user satisfaction and the foundation of platform credibility. Want to know why? Let’s delve into the details.
Unless you’ve been living under a rock, you’ve probably heard about ChatGPT. Since its launch in November 2022, OpenAI’s chatbot has skyrocketed in popularity, amassing over 100 million users. Yet, despite its success, ChatGPT has its flaws.
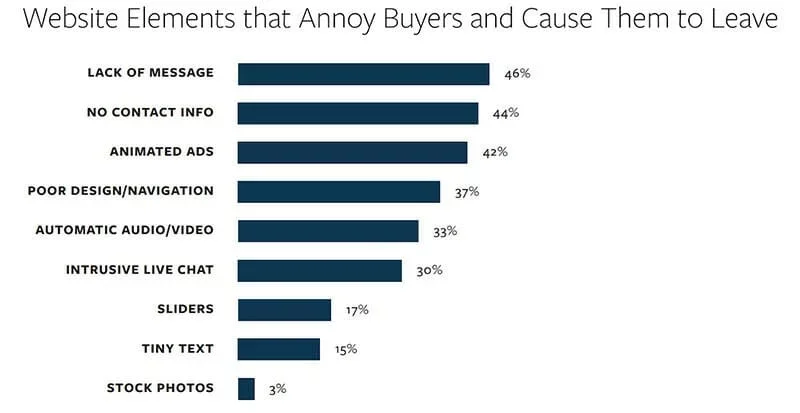
Last year, ChatGPT experienced a significant outage lasting nearly four hours, affecting over 1,200 users. Among those impacted, 82 percent reported performance issues, 11 percent had trouble logging in, and seven percent faced website-related problems.
Although the issue was resolved quickly, frustrated users on Twitter sparked a media frenzy, questioning the platform’s reliability.
But this issue isn’t unique to ChatGPT. In 2023, even major tech companies like Microsoft, Google, and Instagram faced similar problems, leading to widespread disruptions. The high cost of IT downtime underscores the gravity of these incidents.
Recent reports reveal a median annual cost of $7.75 million for an outage. These incidents highlight the vulnerability of digital services and underscore the vital need for proactive frontend application monitoring.
Once considered an afterthought, frontend monitoring has become essential for ensuring consistent performance and rapid issue resolution, ultimately leading to higher user satisfaction.
What is Frontend Monitoring?
Frontend monitoring is a strategic approach that systematically observes and analyzes a website or application’s performance and user interactions. It involves tracking errors, fixing them, and maintaining the health of the application’s frontend.
This process typically uses specialized tools and techniques to measure metrics like page load speed, rendering times, and JavaScript errors.
The goal is to proactively detect performance bottlenecks, glitches, and other issues before they degrade the user experience or lead to user abandonment.
Key Aspects of Frontend Application Monitoring:
- Performance Metrics: Tracking critical metrics such as website load times, rendering speed, and resource usage to pinpoint areas for optimization and ensure quick responses to user actions.
- Error Detection: Monitoring JavaScript errors, console logs, and network requests to identify issues that disrupt user interactions and allow for prompt rectification.
- User Experience Analysis: Real-user monitoring (RUM) provides deep insights into how actual users experience the application, informing design and performance-enhancing decisions.
Why is Frontend Application Monitoring Important?
Frontend application monitoring is the cornerstone of a high-performing website. As a finely tuned engine powers a high-performance car, frontend monitoring drives optimal user experiences on your digital platform. Several critical factors highlight its importance:
- Smooth user experiences: Users expect websites to respond promptly. Frontend monitoring ensures smooth site interactions, preventing frustration and keeping visitors engaged.
- Business success: A slow or glitchy website leads to missed business opportunities. Studies show that even a few seconds of delay can cause visitors to abandon a site. Effective monitoring helps you address these issues promptly, safeguarding potential revenue.
- Search engine visibility: Search engines favor websites that offer fast and reliable experiences. Frontend monitoring supports your website’s search engine optimization (SEO) efforts by ensuring swift load times, indirectly boosting your online visibility.
- Continuous enhancement: Beyond troubleshooting, frontend monitoring drives ongoing improvement. By analyzing user behavior and interactions, you gain insights that guide continuous refinements, elevating your website’s overall quality.
Top Frontend Monitoring Tools of 2024:
1. Sematext
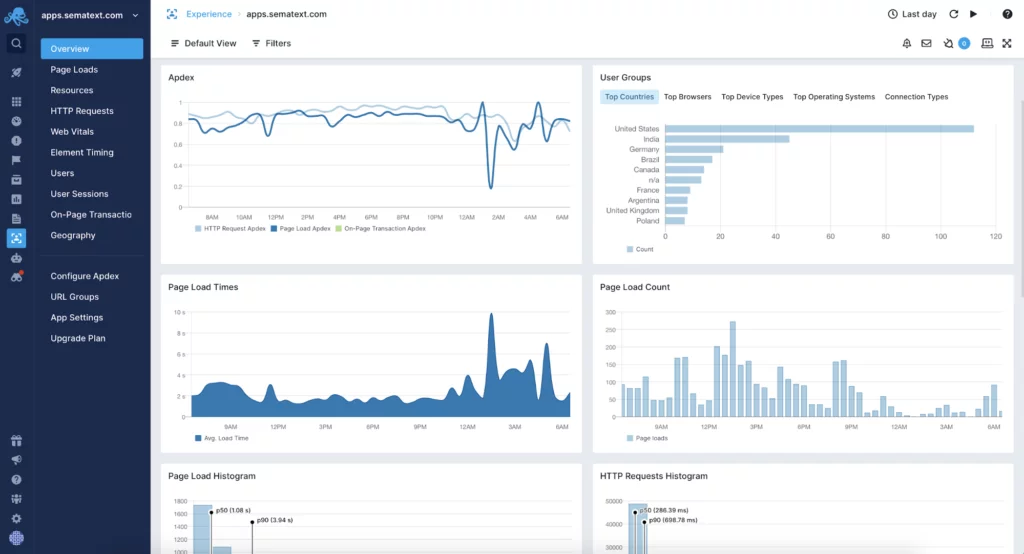
Sematext Cloud is a comprehensive platform designed to meet all your monitoring needs. It offers various tools for performance monitoring, availability checks, error debugging, and infrastructure monitoring.
Sematext Synthetics iallows you to create complex monitors for your resources. These resources can be pinged from multiple locations at intervals ranging from 10 minutes to 60 minutes, providing insights into website speed, error rates, SSL certificate issues, API availability, and website uptime.
Sematext Experience is an actual user monitoring (RUM) solution that provides critical information about your users’ actual experience and satisfaction. It helps you understand how your website or application performs across different locations, devices, and connection speeds, offering metrics like Cumulative Layout Shift, Largest Contentful Paint, and First Input Delay.
A standout feature of Sematext is its integration with Sematext Logs, which aids in debugging performance issues and errors.
With a 14-day trial and affordable pricing options starting at $9/month for Sematext Experience and $29/month for Synthetics, Sematext is an invaluable tool for monitoring your website’s performance.
Features:
- Unified location for logs, metrics, and events
- Identification of resources and requests impacting performance
- Real-time alerts and debugging solutions
- Support for all major frameworks
- Well-documented features
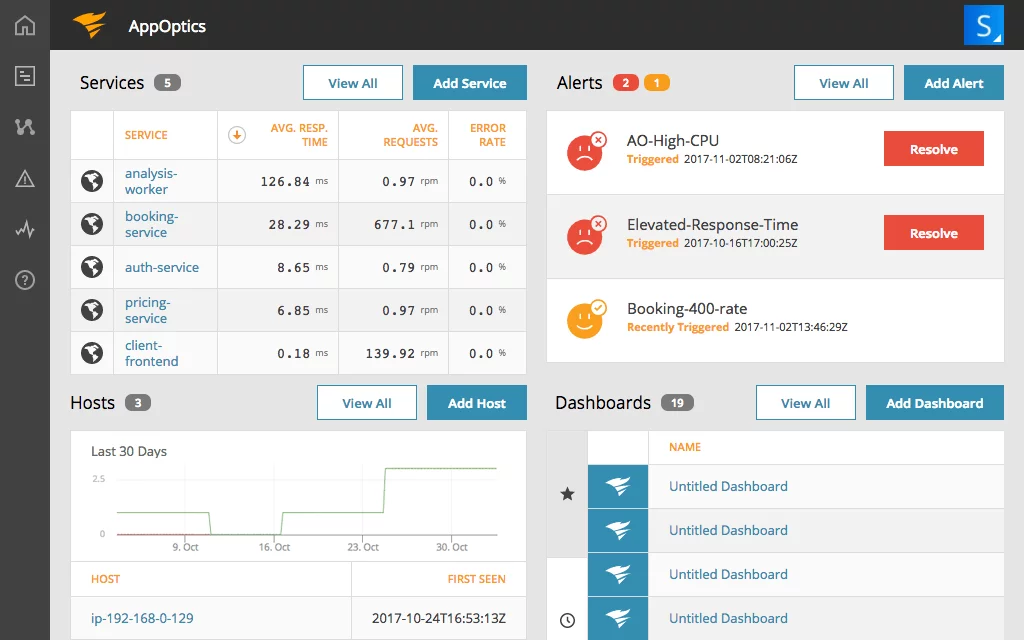
2. AppSignal
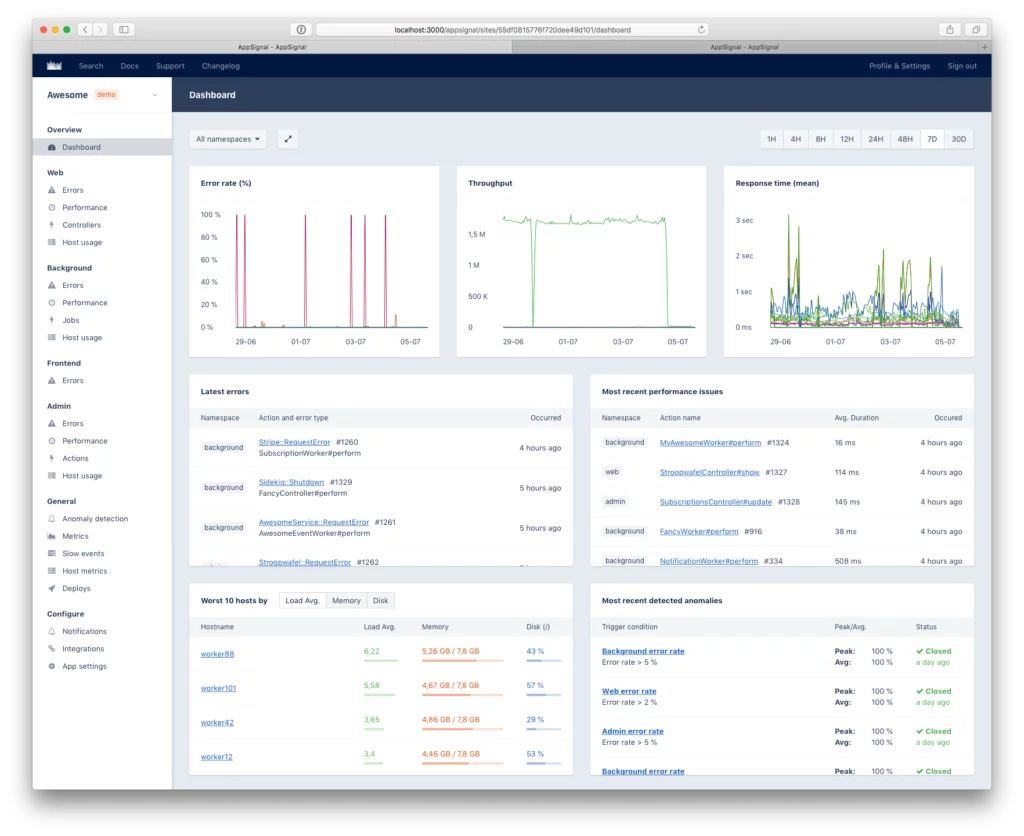
AppSignal provides insights into your application’s performance for front-end and background jobs, host monitoring, error tracking, and metrics collection.
Thanks to its lightweight Rust-powered agent, the tool is simple to install. It monitors your application’s performance, displaying detailed metrics such as CPU usage, memory allocation, and network information. The Event Timeline feature shows what your code is doing, helping you identify performance bottlenecks.
AppSignal includes an anomaly detection system with prebuilt alerts to notify you when things aren’t malfunctioning. While it excels in performance monitoring, it lacks advanced logging and infrastructure monitoring.
AppSignal offers a 30-day trial with pricing based on the number of requests, starting at $19 per month for 250K requests.
Features:
- Anomaly detection
- Out-of-the-box alerts
- Easy installation
- Simple pricing
3. Sentry
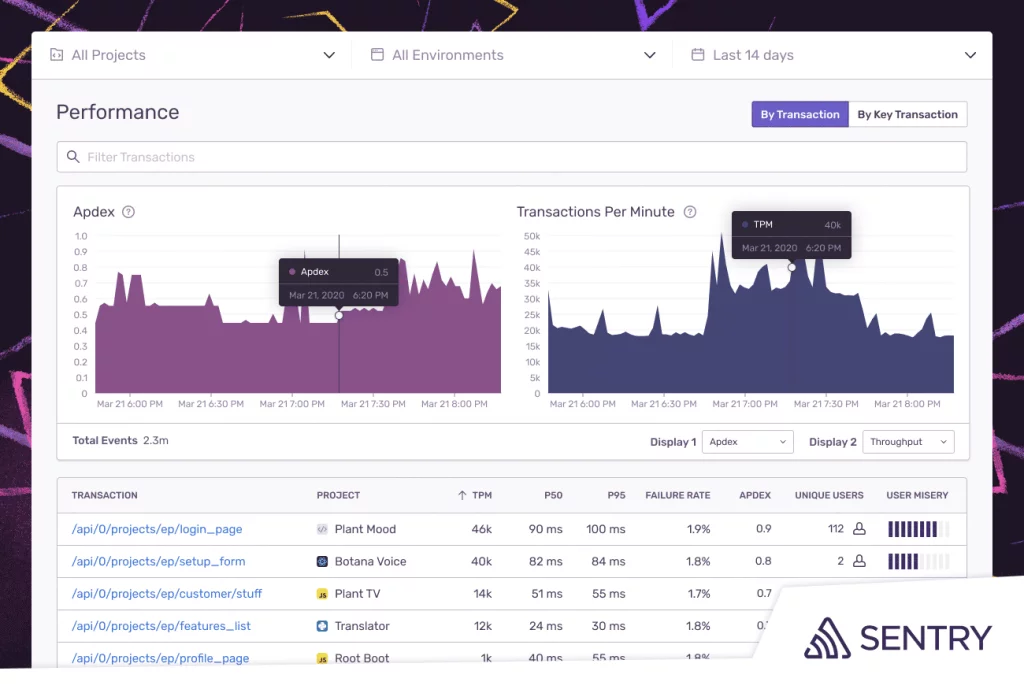
Sentry helps engineering teams detect and resolve user-impacting bugs and issues. It offers an open-source version with the same features as the paid version.
Sentry alerts you when your application crashes or slows, enabling you to address issues before they become errors. The Performance view shows transaction metrics, including an Apdex score, transaction times, and associated resource breakdowns.
Although Sentry supports server-side programming languages, it needs server-specific log integration, which might be a drawback for those seeking an end-to-end monitoring solution.
Sentry provides four pricing plans, including a free tier. Paid plans start at $29 and go upto $2120/month, depending on the number of errors monitored and transactions.
Features:
- Easy installation
- Utilizes Google’s Web Vitals for performance details
- Transaction tracing
4. Site24x7
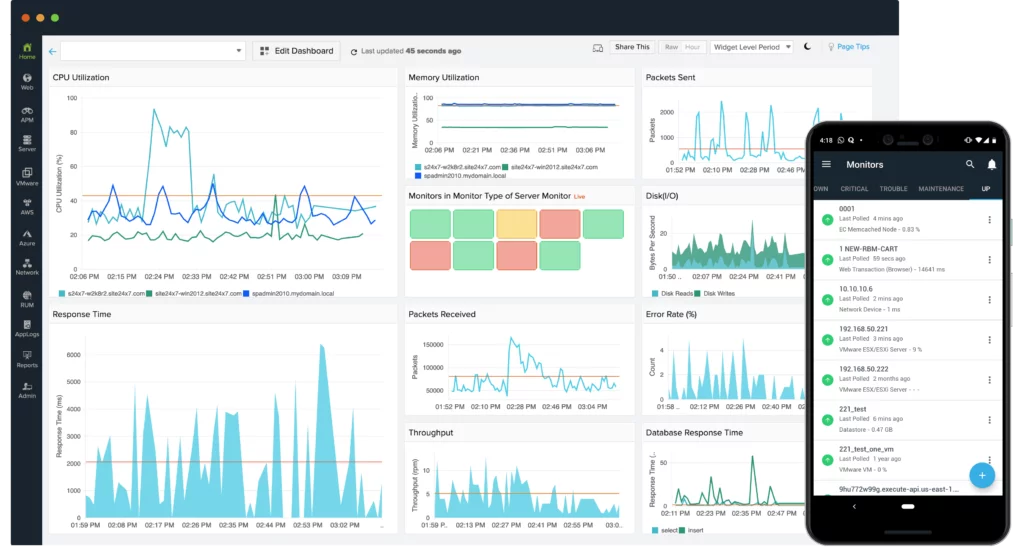
Site24x7 is a comprehensive monitoring solution that offers server monitoring, cloud management, RUM, and more. Its Web section allows you to create monitors for your websites or APIs, collecting data on availability, response time, and downtimes.
Site24x7 tracks SLA compliance, providing a breakdown of availability and response times by location, history of breakdowns, throughput, and response details. It also monitors SSL/TLS certificates and domain expiration, alerting you to issues.
The RUM tool helps you understand user experience, device and browser usage, and user locations. Site24x7’s cloud-based log management also offers centralized log monitoring, simplifying troubleshooting of infrastructure issues.
Site24x7 offers a 30-day trial with no credit card required and four pricing plans starting at $10, going up to $499 per month.
Features:
- All-in-one monitoring solution
- Comprehensive API transaction monitoring
- Real user monitoring tool
5. Pingdom
Pingdom, owned by SolarWinds, is a versatile uptime monitoring service with features such as SSL, uptime, and real-user monitoring.
The uptime monitoring view provides insights into the time it takes for a page or resource to load fully. In case of an error, you can use their incident reports manager to delve into the transaction and identify the root cause, with traceroute being particularly useful here.
Pingdom alerts you whenever an issue arises. These customizable alerts allow you to select who gets notified and when. This ensures that the right person addresses the issue promptly. You can also schedule regular reports on the site health.
For performance reporting, the Page Speed section offers detailed information on load time, page size, the number of requests, and a Performance score, presenting a clear picture of your overall performance. The waterfall chart is especially useful, displaying all assets in a timeline to identify optimization opportunities quickly.
Pingdom focuses on RUM and Synthetics but does not support logs management, which may leave you with only part of the picture when debugging performance issues.
Pingdom offers a 14-day trial, with pro plans starting at $15/month for synthetic monitoring with 10 uptime monitors, one advanced monitor, and 50 SMS notifications. Accurate user monitoring costs $15/month for 100K page views.
Features:
- Simple pricing
- Real user monitoring tools
- SMS and email notifications
- Customizable alerts
6. Raygun
Raygun allows you to identify and resolve performance bottlenecks by providing actionable data from your website, making it easy to diagnose poor user experiences and enhance front-end performance.
Raygun’s real user monitoring platform is essential for diagnosing front-end issues. Its lightweight JavaScript SDK monitors all aspects of your website, gathering information on page speed, load times, active sessions, and active users.
You can view individual user sessions in real time, trace their path, and identify slow or non-loading pages. Each page load features a detailed resource waterfall, breaking down every asset and its impact on performance, helping you pinpoint and resolve issues.
Although Raygun lacks a logs management solution, its Error view provides details like the full stack trace, environment, browser, OS, host, and more.
Raygun offers three packages: APM starting at $8/month (including 10K traces), Real User Monitoring at $8/month for 10K sessions, and Error Monitoring and Reporting at $4/month. A 14-day free trial is also available.
Features:
- Real user monitoring tools
- User-friendly application
- Simple pricing
- Third-party integrations
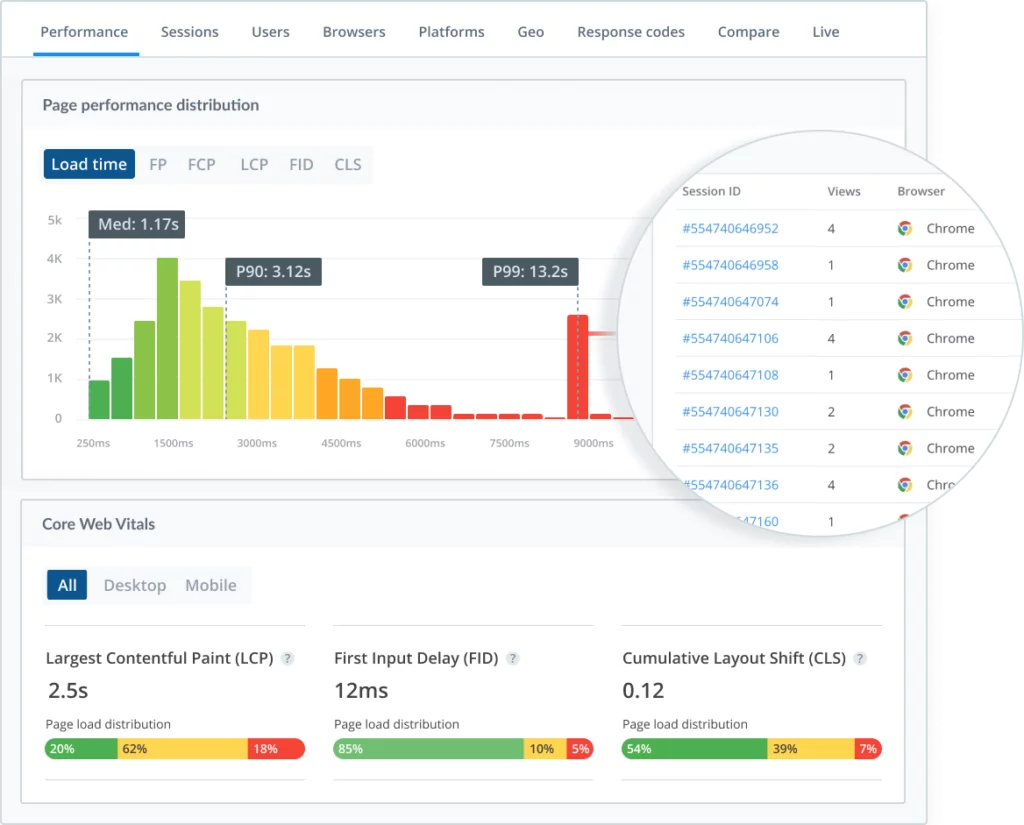
7. SpeedCurve
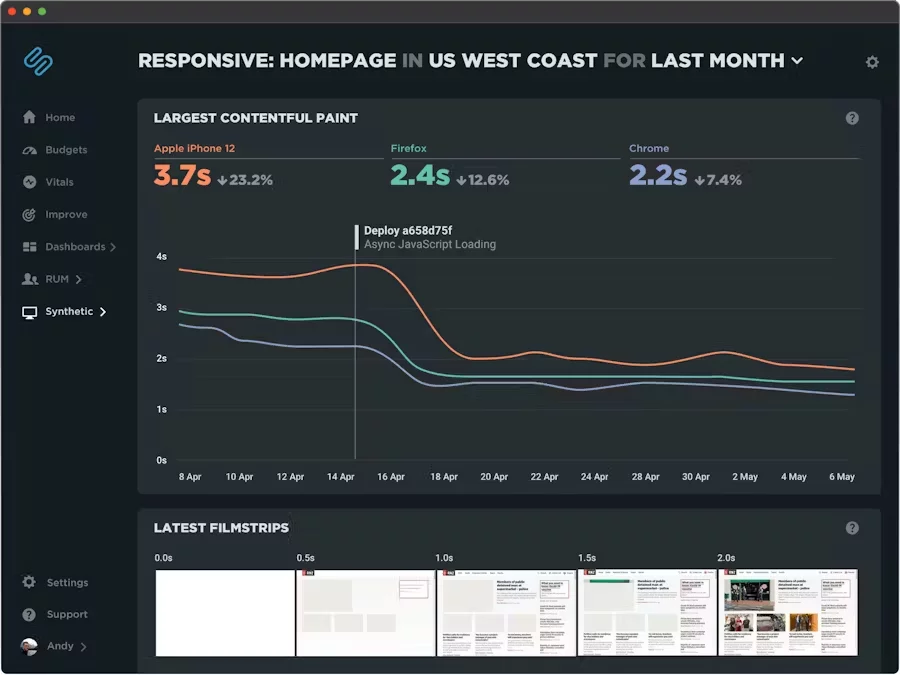
SpeedCurve captures data from the real user interactions and benchmarks it against your competitors, helping you ensure the best possible user experience.
Their real user monitoring tool, LUX (Live User Experience), provides standard RUM metrics like First Input Delay, Largest Contentful Paint (LCP), and Cumulative Layout Shift.
It allows you to set budgets for all your metrics and alerts you if they are exceeded. Alerts can be sent via email or webhooks that integrate with Slack, HipChat, Microsoft Teams, and more.
The synthetic monitoring tool compiles all metrics into a single view for deeper performance analysis, with data broken down into views showing how the website loads across different browsers and devices, responsiveness, third-party resources, JavaScript, and asset breakdowns.
SpeedCurve also features a section powered by Lighthouse, displaying performance metrics and providing improvement recommendations.
SpeedCurve lacks support for logs or transaction monitoring, which may necessitate additional solutions for comprehensive issue tracking.
Pricing is categorized into Small, Medium, and Large plans, with differences in the number of page views and synthetic checks. Prices range from $143/month to $2100/month, with a build-your-own plan starting at $15/month and a free trial available.
Features:
- Real user monitoring tools
- User-friendly UI
- Easy setup
- Simple pricing
8. LogRocket
LogRocket, the real user monitoring tool records user sessions and plays them back to help you identify and resolve issues.
A developer mode breaks down every resource the user loaded, with a console log recording user interactions at the time of the incident, aiding in issue identification without replication.
LogRocket’s basic alerting system notifies you via Slack or email of new errors. It is customizable by specific errors or error count. However, a limitation is the lack of advanced control over alerts and notification channels.
LogRocket does not support logs or transactions but integrates with third-party services providing these features.
LogRocket offers a 14-day trial, a free tier of 30 days retention and 1000 sessions, and a Pro version starting at $99/month for 10K sessions.
Features:
- Inspect logs, network activity, and DOM elements
- Intercom and Zendesk support
- Video playback of incidents
Benefits of Using Frontend Monitoring Tools:
- Proactive issue detection: These tools act as digital sentinels, alerting developers to performance bottlenecks, errors, or unusual behaviors before users notice them. This allows you to address issues before they impact users.
- Precise performance insights: Frontend monitoring tools provide detailed data on load times, rendering speeds, and user interactions. This granular information is invaluable for identifying areas that require improvement and optimization.
- Real-time user experience analysis: Many front-end monitoring solutions feature Real User Monitoring (RUM) capabilities. This lets developers observe how users navigate your website, offering valuable insights to guide design decisions and user-centric enhancements.
- Resource allocation efficiency: These tools help direct your development efforts toward areas that need the most attention. Instead of unthinkingly tackling issues, developers can prioritize based on data-driven insights, resulting in more effective and meaningful improvements.
Mastering Website Performance Testing for Optimal Speed and User Experience
Crafting a Frontend Monitoring Strategy: A 5-Step Plan
1. Define What to Monitor
Begin by identifying the elements of your front end that require monitoring and evaluation. This foundational step ensures that you focus on critical aspects directly impacting user experience and align your monitoring efforts with your application’s essential functionalities. Doing so prevents overwhelming data collection and directs your attention to the most valuable metrics, enabling a targeted and actionable monitoring approach.
Key Metrics to Monitor:
- Page Load Times: Measure the speed at which your pages load to ensure optimal user experiences.
- Responsiveness: Assess how swiftly user interactions are processed and displayed.
- Error Rates: Keep an eye on errors that might disrupt user journeys.
- User Interactions: Analyze how users engage with your application’s features and functionalities.
- Conversion Funnel: Track the progression of users through key conversion steps.
- Third-Party Integrations: Monitor the performance of integrated services or scripts.
- Device Compatibility: Ensure consistent performance across various devices and screen sizes.
2. Choose a Tool Compatible with Your App’s Language
Select a frontend monitoring tool that aligns with the programming language and framework used to build your application. Compatibility with your app’s language ensures accurate data collection and meaningful insights. It allows the tool to effectively interact with your application’s codebase, providing relevant performance metrics and facilitating efficient integration. This compatibility streamlines the monitoring process and enhances the tool’s effectiveness in identifying issues specific to your technology stack.
3. Monitor System Usage During Peak Activity.
Closely observe your application’s performance and resource usage during high-user activity periods. Monitoring system usage during peak times provides valuable insights into how your front end handles heavy traffic. It helps identify potential performance bottlenecks, ensuring your application remains responsive and functional despite intense user demand. This step prevents performance degradation during critical moments and provides a consistently positive user experience, especially during peak usage.
4. Align Analytics Data with Business Metrics
Bridge the gap between data collected from frontend monitoring and the key business metrics driving your organization. Linking analytics data with business metrics provides a holistic understanding of how front-end performance influences your bottom line. It enables you to quantify the impact of performance on user behavior, conversions, and overall business success. By aligning technical insights with business objectives, you gain actionable insights that drive informed decisions and prioritize optimizations that directly impact your organization’s goals.
Metrics that Matter:
- Bounce Rates: Correlate slow load times with bounce rates to understand how performance affects user engagement.
- Conversion Rates: Analyze the relationship between front-end improvements and changes in conversion rates.
- Revenue: Connect frontend performance with revenue fluctuations to assess the financial impact of user experience.
- User Engagement: Link performance enhancements to user engagement metrics, like the time spent on site and interactions per session.
- User Journey: To identify critical touchpoints, map frontend performance to different user journey stages.
5. Monitor, Monitor, and Monitor
Regular and continuous monitoring ensures that your application’s performance remains optimal. By consistently tracking metrics, you can detect issues early, prevent performance regressions, and quickly address emerging challenges. This step ensures that your front end consistently delivers a user experience that aligns with user expectations and business objectives.
Benefits of Ongoing Monitoring:
- Proactive Issue Resolution: Detects and addresses potential problems before they impact users, maintaining a high level of performance.
- Adapt to Changes: As your application evolves, continuous monitoring helps you adapt to new features, updates, and changes in user behavior.
- Data-Driven Improvements: Ongoing monitoring provides a consistent data flow for informed decision-making and optimization strategies.
- Build User Trust: Reliable performance boosts user confidence, fostering trust and loyalty in your brand.
- Stay Competitive: Continuous monitoring helps you stay competitive by keeping your front end up to par.
Learn about backend performance optimization here.
How to Choose the Best Frontend Monitoring Tool:
Selecting the right front-end monitoring tool is essential for maintaining the performance and reliability of the website. Here are key factors to consider:
- Programming language compatibility: Ensure the monitoring tool matches your website’s programming languages and technologies. Proper language support is crucial for accurate performance tracking. Without it, the tool may miss essential metrics, making it ineffective for monitoring your application.
- Cloud vs. on-premise: Cloud-based frontend monitoring solutions are often preferable over on-premise solutions. Cloud-based tools are hosted on external servers managed by the provider, offering scalability, reduced maintenance overhead, and built-in redundancies for enhanced reliability. In contrast, on-premise tools require installation and self-management, demanding additional resources for upkeep, security, and upgrades.
- Ease of use: Evaluate the frontend monitoring tool’s ease of use, including the intuitiveness of its interface and overall usability. A user-friendly tool simplifies navigation, monitoring parameter setup, and data interpretation. This streamlines the monitoring process, shortens the learning curve, and expedites issue identification and resolution.
- Agent vs. agentless: Based on your application’s needs, decide between agent-based and agentless front-end monitoring. Agents are software components integrated into your application’s codebase, offering in-depth insights but requiring integration and maintenance. Agentless monitoring collects data remotely without installing software on your servers, simplifying setup but potentially providing less comprehensive data.
- Security: Pay close attention to the security features of front-end monitoring tools. This includes secure data transmission, storage, and access control to protect sensitive data collected during monitoring. A breach in monitoring data could compromise user data and expose vulnerabilities. Assess factors like data encryption, access controls, and compliance with data protection regulations to ensure the security of your monitoring tool.
- Pricing: Consider the monitoring tool’s pricing model. Different tools offer various pricing structures, including subscription plans, tiered pricing based on usage, and pay-as-you-go models. Ensure that your budget aligns with the chosen plan and understand the features included in each pricing tier. Additionally, evaluate how pricing may scale as your application grows and whether the tool’s features justify the cost.
Conclusion:
By leveraging the power of frontend monitoring tools, you can proactively identify and resolve issues before they affect your users, leading to higher satisfaction and retention rates. These tools provide valuable insights into real user experiences, helping you optimize load times, responsiveness, and overall site functionality.
Regularly reviewing and analyzing the data from these tools allows you to stay ahead of potential problems and continuously improve your website. Incorporating frontend monitoring into your development and maintenance workflows ensures that your site remains competitive and delivers a superior user experience.
FAQs on Frontend Monitoring Tools:
How do frontend monitoring tools differ from backend monitoring tools?
Frontend monitoring focuses on the user interface and client-side performance, ensuring that web pages load quickly and function correctly on the user’s device. In contrast, backend monitoring targets server-side operations, tracking server performance, database queries, and server errors.
Can frontend monitoring tools help in improving SEO?
Yes, frontend monitoring tools can significantly impact SEO. Search engines consider page load speed and user experience as ranking factors. By optimizing these aspects through frontend monitoring, you can improve your website’s search engine rankings.
How often should I review the data from frontend monitoring tools?
Regularly reviewing the data is essential. Ideally, you should check the key metrics daily or weekly to quickly identify and address any issues. For significant updates or changes to your website, more frequent monitoring might be necessary to ensure everything runs smoothly.
Can frontend monitoring tools detect security issues?
While frontend monitoring tools primarily focus on performance and user experience, some can also identify potential security issues like cross-site scripting (XSS) attacks or insecure resource loading. However, for comprehensive security monitoring, you should use dedicated security tools in conjunction with frontend monitoring.
How do I get started with frontend monitoring for my website?
To get started, choose a frontend monitoring tool that fits your needs and budget. Integrate it into your website by following the provided documentation, typically involving adding a snippet of JavaScript code to your pages. Once set up, configure the tool to track the desired metrics and start monitoring your website’s performance.
What should I do if my frontend monitoring tool reports an issue?
When an issue is reported, prioritize it based on its impact on user experience. Investigate the root cause, which may involve debugging code, optimizing resources, or addressing third-party script performance. Implement the necessary fixes, and monitor the site to ensure the issue is resolved.
