
Synthetic monitoring has long been a cornerstone of performance testing, and it’s poised to remain indispensable for the foreseeable future. Also known as proactive monitoring, this straightforward approach ensures you stay informed about your website’s performance, making it your best assurance of meeting visitor expectations.
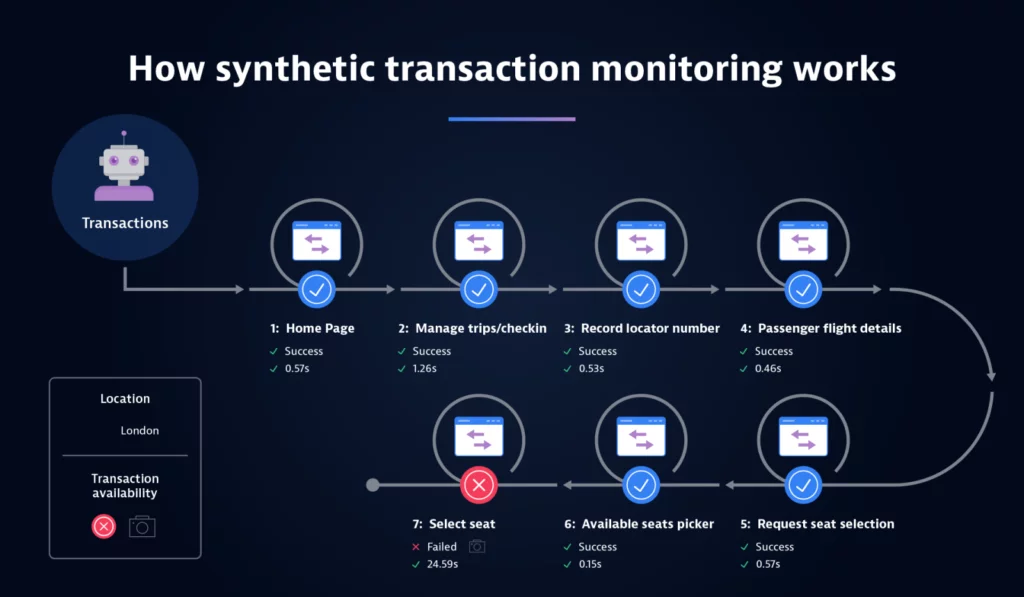
Synthetic monitoring tools operate by executing simulated user interactions on your website, offering detailed insights into application performance, uptime, certificate validity, load times, API functionality, and much more. They can even be configured to conduct intricate requests, thoroughly testing critical business transactions.
While synthetic monitoring’s capabilities are impressive, the challenge lies in selecting the right tool from the multitude available on the market. Each tool offers unique features and strengths, so understanding your specific requirements is important in making an informed choice.
There are two approaches for assessing web performance: Synthetic Monitoring, also known as Active monitoring, and Real User Monitoring (RUM), also known as Passive monitoring. Although often viewed as contrasting methods, they complement each other.
A Guide to WordPress Website Monitoring: Ensuring Smooth Sailing
Synthetic Monitoring (aka Active Monitoring)
- Benefits of Synthetic Monitoring: Synthetic Monitoring allows precise control over test conditions, enabling repeated scenario testing to compare performance metrics before and after optimizations. It identifies issues specific to user categories, such as geographic areas or device types.
- Tools for Synthetic Monitoring: Examples include WebPageTest, SpeedCurve, Dareboost, and PageSpeed Insights.
- When to Utilize Synthetic Monitoring: It’s ideal for technical benchmarking to assess site performance relative to competitors under specific browsing conditions. Performance budget monitoring ensures adherence to predefined thresholds, while Single Point Of Failure (SPOF) reporting identifies bottlenecks impacting user experience.
- Types of Data Collected by Synthetic Monitoring:
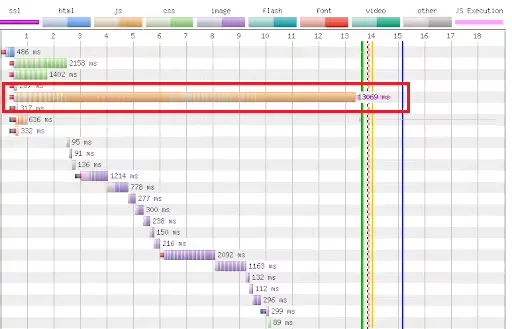
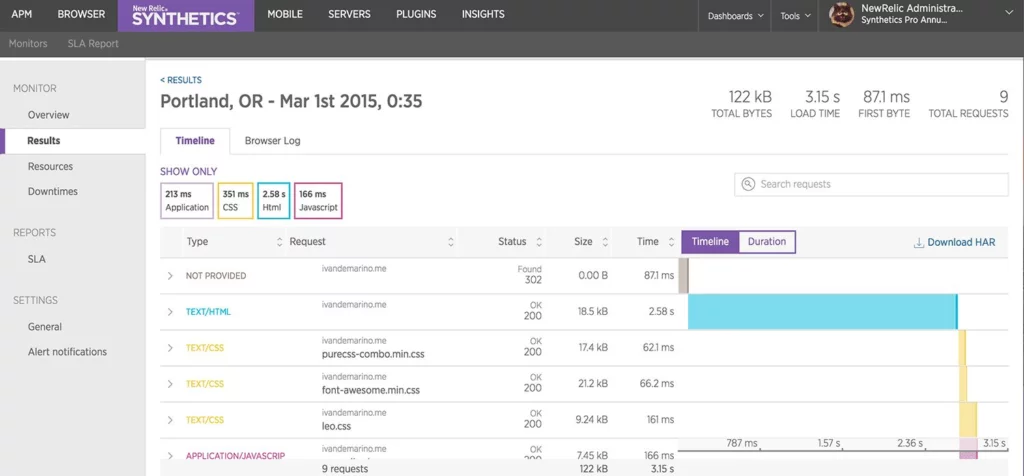
A. Waterfall Charts: Waterfall charts visually represent the sequence and timing of each element loaded on a web page. They provide insights into the loading process, highlighting which resources (such as images, scripts, stylesheets) are responsible for delays in page rendering. Web developers and performance analysts use waterfall charts to identify and optimize the performance of individual page elements.
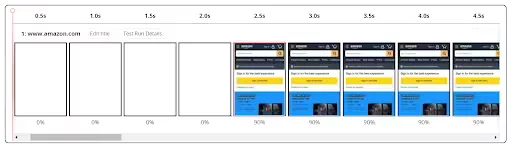
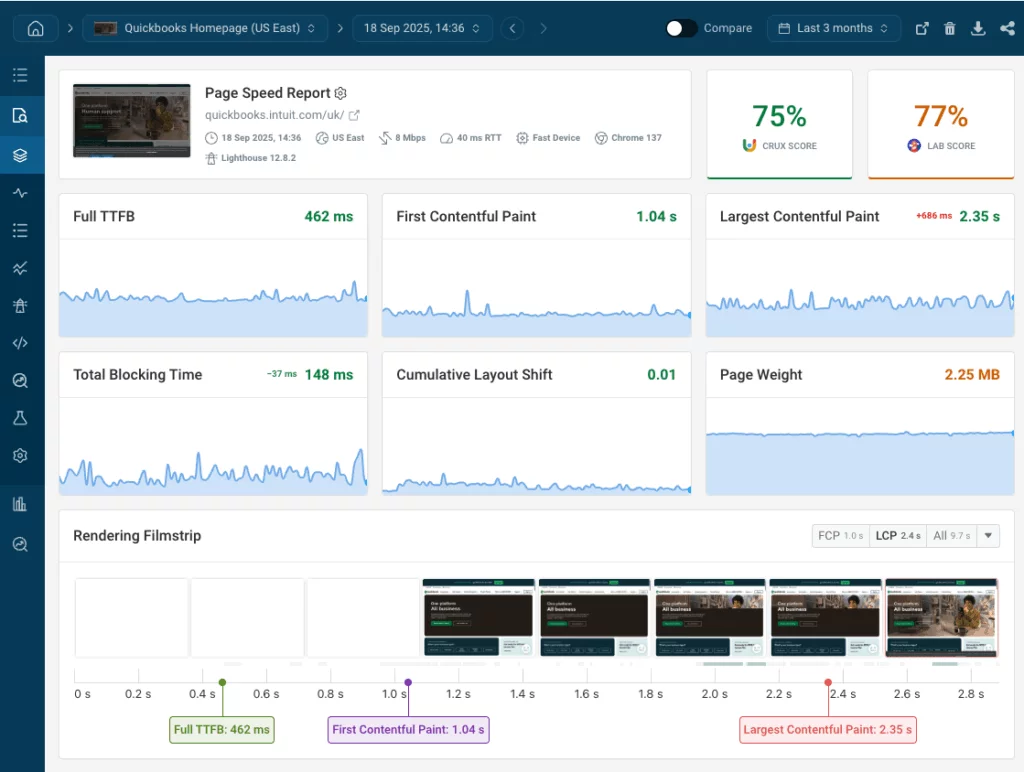
B. Filmstrips: Filmstrips capture snapshots of the web page as it loads, presenting a visual timeline of how the page appears at various stages of loading.They help visualize the user experience during page load, showing what the user sees and how the page evolves.Usage: Filmstrips help understand visual progress and identify rendering issues affecting user perception and engagement.
C. Technical Data: This includes metrics such as the number of HTTP requests made by the browser, the page’s total size (weight) and resources, and the server response time (Time To First Byte – TTFB). These metrics offer insights into resource delivery efficiency and server responsiveness, which are critical for optimizing page speed and performance. Developers use technical data to diagnose network and server-side issues impacting page load times and overall performance.
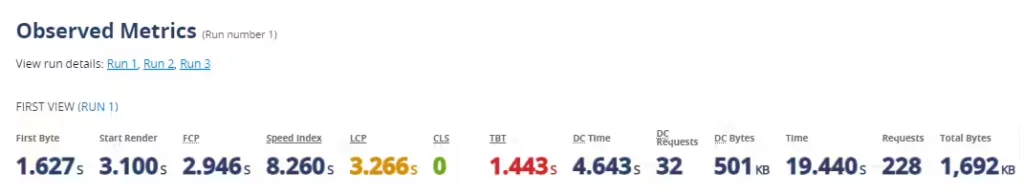
D. Performance Metrics: Performance metrics include indicators like Speed Index, Start Render time, Time to Interactive (TTI), and Core Web Vitals (such as Cumulative Layout Shift Largest Contentful Paint).They measure various aspects of user-centric performance, including visual load speed, interactivity, and stability of web pages. These metrics help set performance benchmarks, track improvements, and ensure adherence to performance budgets.
Real User Monitoring (aka Passive Monitoring)
- Benefits of Real User Monitoring: RUM continuously collects data on user interactions and performance metrics across various conditions without predefined test setups.
- Tools for Real User Monitoring: Examples include Pingdom, Google Analytics, and Treo.
- Data Collected via Real User Monitoring: RUM tools leverage Navigation Timing and Resource Timing APIs to measure loading times of static resources and track user engagement and conversion rates.
- Types of Data Collected by Real User Monitoring (RUM):
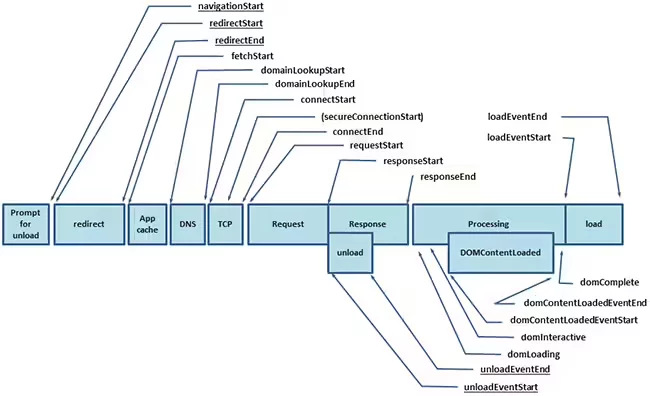
A. Navigation Timing: RUM tools utilize the Navigation Timing API to capture detailed timings related to the navigation of a web page. It provides metrics such as DNS resolution time, TCP connection time, DOM interactive time, and page load time from the perspective of actual users. Navigation Timing data helps understand the end-to-end user experience, identify page loading bottlenecks, and optimize server and network performance.\
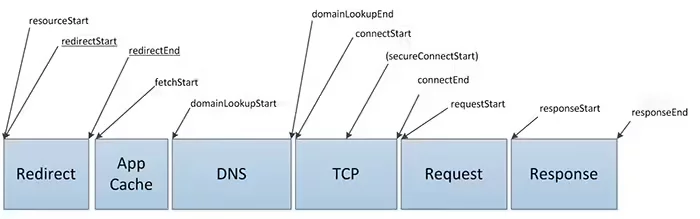
B. Resource Timing: Resource Timing API measures the loading time of each static resource (images, scripts, stylesheets) on a web page. It offers granular insights into the performance of individual resources, pinpointing which resources contribute most to page load times. Developers use Resource Timing to optimize resource delivery strategies, reduce load times, and improve page performance.
C. User Timing: The User Timing API allows developers to instrument custom performance metrics by marking specific events within the browser. It enables tracking application-specific interactions and performance milestones critical to user experience. User Timing data helps measure and optimize the timing of key user interactions, such as form submissions, button clicks, or AJAX requests.
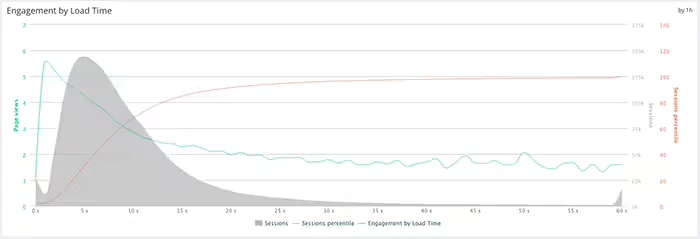
D. Conversion Rates and Business Data: Some RUM tools can correlate web performance metrics (like page load times) with business outcomes such as conversion rates, bounce rates, and revenue. This correlation helps businesses understand how website performance impacts user behavior and business objectives. Organizations can prioritize performance optimizations that directly impact revenue and user engagement by analyzing conversion rates alongside performance metrics.
When Do You Need Synthetic Monitoring?
Synthetic monitoring should ideally be implemented before your website gains traffic. This preemptive setup establishes performance benchmarks, enabling you to compare and optimize against competitors.
Synthetic monitoring once your website is operational helps validate scalability and readiness to handle user demands effectively.
The ongoing use of synthetic monitoring ensures proactive issue detection, minimizes mean time to repair (MTTR), and preempts user-facing problems.
Top Synthetic Monitoring Tools of 2024:
1. Sematext
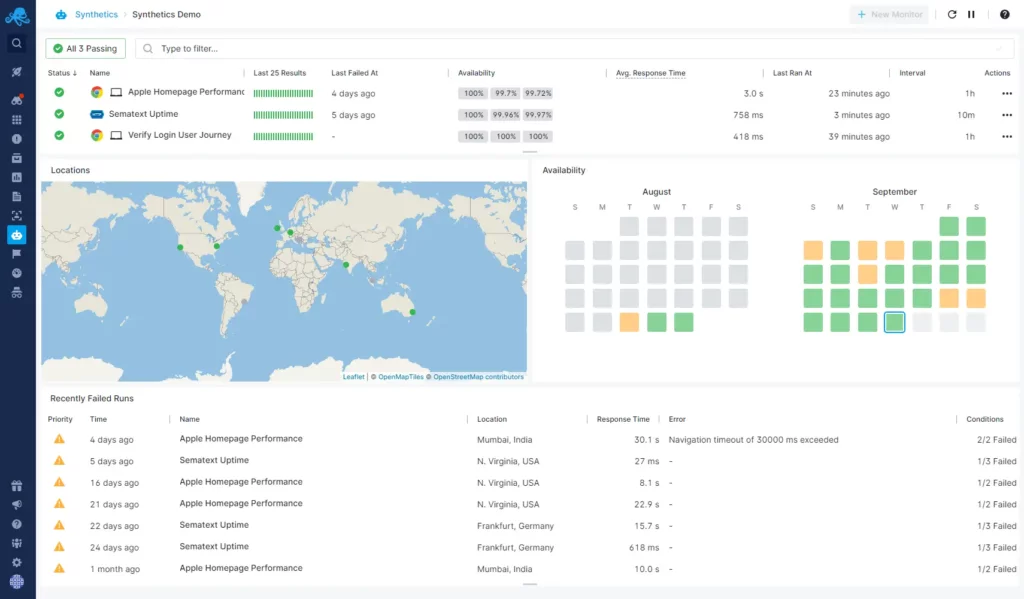
In recent years, Sematext has emerged as a preferred choice in the DevOps community for application performance monitoring. By integrating synthetic and real user monitoring tools, it has evolved into a comprehensive full-stack monitoring and observability platform known for its reliability, user-friendly interface, and robust feature set.
Sematext’s synthetic monitoring solution, enables global monitoring of APIs and websites, assessing performance across various devices, browsers, and network connections. It provides essential metrics such as website speed, error rates, and SSL certificate validity, among others. Additionally, it supports website benchmarking to pinpoint areas for optimization and enhance overall performance.
Access the intuitive UI to configure diverse testing scenarios with customizable parameters upon signup. Notifications are sent through your preferred channels each time a test fails.
Pros
- Extensive library of third-party integrations
- Monitoring capability behind firewalls
- Includes logs, infrastructure monitoring, and Real User Monitoring (RUM)
- Transparent pricing with no hidden costs
- Flexible pay-as-you-go subscriptions are available
- Supports complex multi-step user journeys using Puppeteer
- Integration with CI/CD pipelines
Cons
- No browser extension available for recording transactions
Pricing: Sematext Synthetics offers a free trial with plans starting at $29/month. Plans include 40 HTTP monitors and 5 browser monitors with a data retention period of 30 days. Customization options include a Pay-as-you-go plan for setting up individual monitors at $2/month. A 14-day free trial is offered without requiring credit card details.
2. DebugBear
Founded in 2018, DebugBear’s approach to web performance monitoring focuses on Google’s Core Web Vitals metrics. By combining both synthetic and real user monitoring it provides a comprehensive assessment of your website speed.
Its synthetic test reports come with custom performance recommendations, a detailed request waterfall, as well as insights into CPU activity and third-party code. DebugBear also includes an experiments feature that lets you see how different optimizations would impact your metrics without needing to deploy any code.
Test page load time from over 20 different test locations and get alerted to any changes over email, in Slack, or in Microsoft Teams.
Pros
- Synthetic and real user data
- In-depth web performance reports
- Built for Core Web Vitals
Cons
- No high-frequency uptime monitoring
- Relatively expensive
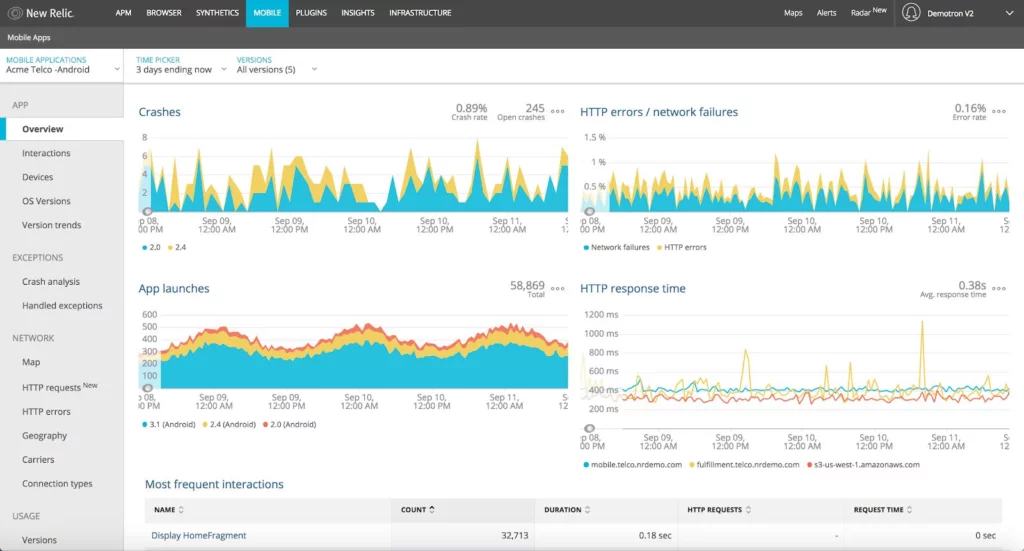
3. New Relic
New Relic Synthetics ensures seamless execution of critical transactions by conducting tests every minute from its eight global locations. Monitoring your system’s availability is effortless with simple, complimentary ping checks.
This synthetic monitoring software utilizes JavaScript-like scripting to create sophisticated tests. It collects performance data and logs errors for efficient debugging.
While tests can originate from any available location upon signup, New Relic also accommodates private location additions, facilitating resource monitoring within your firewall or from strategically relevant geographical areas.
Pros
- Diverse performance monitoring and testing tools
- Strong support and extensive community
- Effective third-party integrations
Cons
- Complex dashboard navigation, especially with multiple applications
- Relatively high cost, starting at $49/month with a free trial.
4. Dynatrace

Dynatrace Synthetic Monitoring enables global performance monitoring and simulation of user interactions, offering detailed business insights in an easily understandable timeline accessible to your entire team.
Dynatrace provides comprehensive performance and availability monitoring across all your resources, continuously executing monitors from private and public locations.
Its innovative web-based recorder allows simulation and measurement of critical customer journeys without requiring script writing. This includes playing scripted transactions with keyboard and mouse interactions, mimicking real user behavior, and running simulations on browsers.
Pros
- All-in-one monitoring solution
- AI assistance
- Extensive library of third-party integrations
Cons
- Complex dashboard due to the volume of data presented
- Potential for unreliable alerts due to baseline alerting system
- Pricing starts at $11/month with a free trial available.
5. SpeedCurve
SpeedCurve leverages WebPageTest, a popular synthetic performance tool highly regarded in the web development community. It has the added capability of continuous testing across multiple sites.
An outstanding feature of SpeedCurve is its custom metrics monitoring. This enhances standard web performance metrics to provide a clearer understanding of website performance. Custom metrics can be shared on customizable dashboards tailored for your team.
SpeedCurve further enhances its testing capabilities with mobile device emulation and CPU throttling, providing insights into site performance across various mobile devices.
Pros
- Transparent billing structure
- Mobile device emulation & CPU throttling
Cons
- Limited to single solution product; requires separate software for infrastructure monitoring
- Pricing starts at $12/month with a 30-day free trial available.
6. Catchpoint

Founded in 2008, Catchpoint specializes in continuous performance optimization through extensive testing and measurement across various industries.
Catchpoint’s synthetic monitoring solution combines simulated and real user monitoring from over 210 global locations. When predefined thresholds are exceeded, it features a robust alert system that notifies your team across multiple channels, such as Slack, VictorOps, and PagerDuty.
This tool facilitates faster issue detection and resolution, analysis of user experiences, optimization of service delivery, and ensures the reliability of critical systems.
Pros
- 20 different monitor types
- Over 210 nodes in more than 80 countries
Cons
- Lack of self-service options
- Relatively expensive
- Limited visibility in data extraction based on user reviews [1,2,3]
- Pricing starts at $15 for 10k tests, with a 14-day free trial available.
7. Uptrends
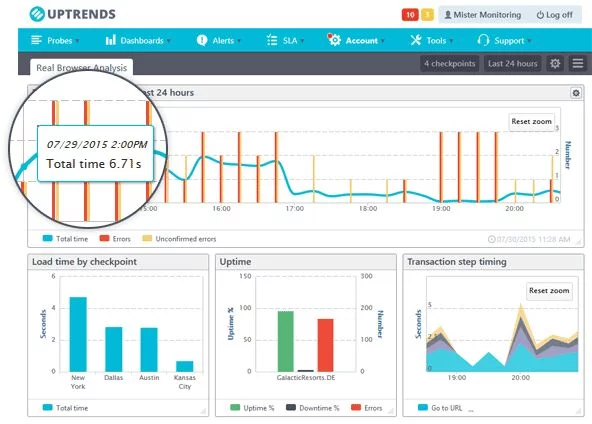
Established in 2007, Uptrends boasts a user base of over 20,000 clients, including prominent companies like Virgin, Vimeo, and Zendesk. Its primary focus is to deliver straightforward synthetic monitoring services that provide clear insights into end-user experiences.
Uptrends operates 223 checkpoints globally, which serve as testing locations. These checkpoints enable simulated tests that capture and record any issues that arise, including screenshots for visual verification.
Upon registration, Uptrends automatically sets up a customizable dashboard to facilitate website monitoring, offering flexibility for further customization.
Pros
- Positive user experiences with customer support [1,2]
- User-friendly UI with robust features
- Infrastructure monitoring available
Cons
- Alerts require proper configuration; UI reported as less intuitive by multiple users [1,2,3,4]
- Pricing starts at $24/month with a free basic plan available.
8. Site24x7
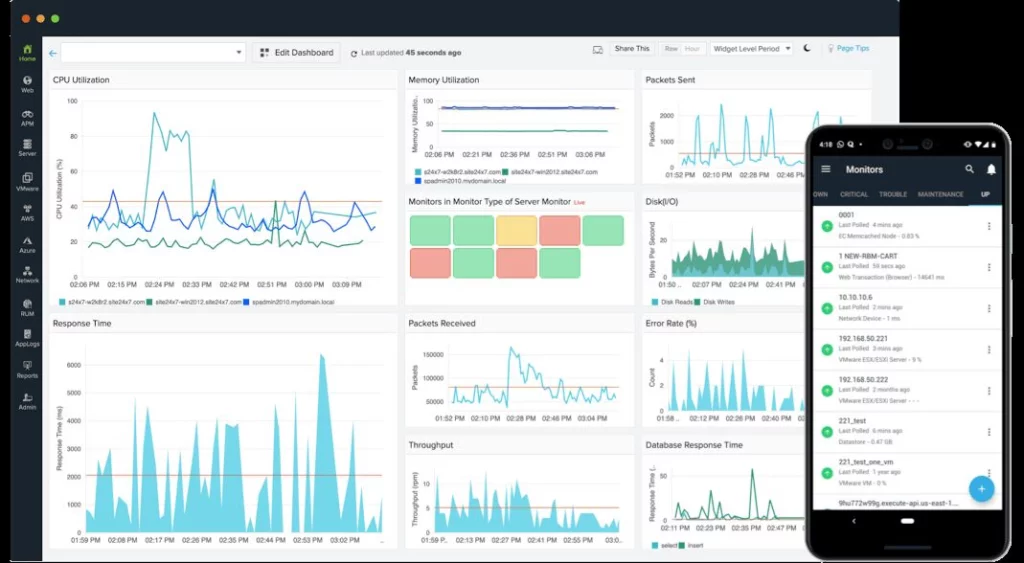
Site24x7, developed by Zoho, is a cloud-based full-stack monitoring tool designed for DevOps and IT teams to oversee resources and infrastructure comprehensively.
Its synthetic monitoring tool facilitates site availability monitoring with periodic tests conducted from 110 global locations, verifying responses. Moreover, Site24x7 monitors dependent resources such as DNS servers, SSL certificates, mail servers, and WebSocket endpoints, providing a detailed view of system resources.
Site24x7 enables faster issue detection and resolution, ensuring optimal site performance by proactively managing site issues, monitoring third-party APIs, and simulating complex business transactions.
Pros
- Flexible pricing options
- Coverage from 110 testing locations
- APM, Cloud, and Server monitoring capabilities
Cons
- UI complexity can make data interpretation challenging due to extensive lists, graphs, and data on screens
- Pricing starts at $9/month with a 30-day free trial available.
9. Checkly
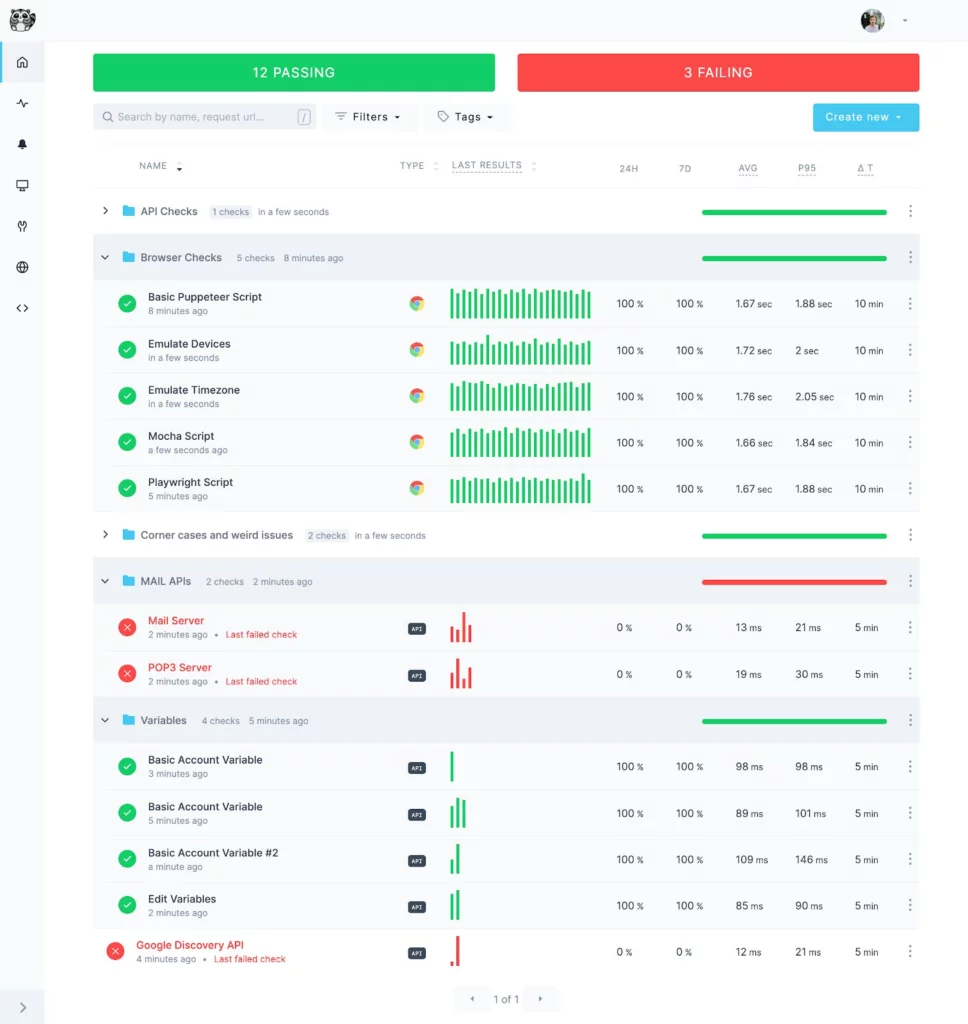
Checkly, a newcomer to the market, focuses on equipping DevOps teams with tools to build modern systems. It emphasizes JavaScript-based open-source tech stacks that integrate seamlessly into development workflows.
Checkly’s synthetic monitoring tool executes tests using actual Chrome browsers, providing authentic user conditions without filtration. Each transaction undergoes validation; every test step includes a screenshot for visual verification.
The tool features a headless recorder and a user-friendly Chrome extension, enabling script initiation and recording within minutes. This simplifies comprehensive website testing without requiring code writing, script adjustment, or manual form filling.
Pros
- Chrome extension for ease of use
- Competitive pricing
- Strong third-party integrations
Cons
- Focus limited to synthetic monitoring; lacks infrastructure and real user monitoring
- Pricing starts at $30/month with a free plan and 30-day trial available.
Best Practices to Use Synthetic Monitoring Tools:
1. Set Alerts
Synthetic monitoring actively tracks your web applications to ensure optimal performance. This includes monitoring:
- Uptime
- Page speed
- Transaction performance
Synthetic monitoring tools simulate activity on your web applications and services, checking key components such as web pages, APIs, DNS, and network availability. They record page load times and verify the smooth operation of site transactions.
These tools promptly send alerts upon detecting outages or performance issues with your web application. You can set performance benchmarks and receive alerts if your site falls below expected levels. The tools test from multiple probes to validate alerts, reducing false positives.
Customization options include:
- Alert delivery methods: SMS, email, push notifications (Android/iOS), or integration with apps like Slack, VictorOps, OpsGenie, and PagerDuty.
- Alert timing: Configure alert timing and re-send options up to four times until confirmation of site recovery.
- Team notifications: Notify team members instantly, with options to customize alerts based on incident severity.
Customizing alert settings ensures swift responses to website issues, minimizing customer disruption and revenue loss.
2. Set Up Transaction Monitoring
While uptime and page speed are commonly monitored, transaction monitoring is crucial for testing every user interaction on your website, ensuring functionality.
For instance, transactional monitoring for an eCommerce store validates the checkout flow. Upon detecting issues, alerts are triggered for immediate action, preventing potential customer loss.
Synthetic transaction tools allow you to monitor various site interactions:
- New user registrations
- User login
- Search functions
- Shopping cart checkout
- Form submissions
- URL interactions
These tools simplify transaction setup without coding. Choose from a range of commands and elements to simulate site interactions effectively.
Global testing ensures an accurate representation of user experience. Immediate alerts notify you of any issues detected, enabling proactive resolution before impacting user satisfaction.
3. Test from Multiple Locations
Synthetic monitoring tools can test your website’s performance from diverse geographical locations worldwide. These tests offer a simulated yet accurate representation of user experience variations based on their location.
Monitoring page load times and website availability becomes crucial if your target audience is concentrated in specific regions. This ensures prompt detection and resolution of performance issues, enhancing user experience for your most critical customer segments.
Utilizing a network of over 100 servers globally, you can conduct tests from various regions, including North America, South America, Europe, Asia, and Australia. Each area offers up to 10 probe servers that actively monitor your website’s speed, uptime, transaction performance, and more, promptly alerting you to any detected issues.
Testing from multiple locations provides insights into localized performance issues such as speed variations or content delivery network (CDN) outages specific to certain regions. This data empowers you to optimize your website further, particularly in the high-revenue areas.
4. Understand the Reports
Cloud performance monitoring generates substantial data, and maximizing the utility of monitoring tools requires proficiency in interpreting reports and implementing necessary improvements.
Pingdom employs intuitive visual graphs and charts to facilitate an understanding of your website’s performance and actionable insights:
- Uptime reports: Track uptime, downtime, and response times over specific periods. Pingdom conducts additional tests to pinpoint the root cause upon detecting issues, facilitating swift resolution. Detailed traceroutes reveal server outputs and response codes, aiding in proactive problem-solving and preventive measures.
- Transaction reports: Review average transaction execution times and identify any outages detected within defined periods. Pingdom’s dashboard visualizations highlight anomalies, guiding optimization efforts.
- Page speed reports: Comprehensive tests evaluate the loading speed of every website asset, from HTML to CSS and JavaScript. Detailed data identifies elements requiring optimization to effectively enhance page size and load times.
5. Use Both Synthetic and Real User Monitoring
Synthetic monitoring and real user monitoring (RUM) are complementary tools for monitoring web application health and performance:
- RUM: Tracks user interactions on your website, providing insights into real-time user experience and performance metrics. Analyze user journeys and loading times across different devices, browsers, and geographic locations. Long-term data analysis helps gauge the impact of performance improvements over time.
- Synthetic monitoring: Offers proactive identification of performance issues in near real-time through simulated tests. Use synthetic monitoring to delve into specific performance aspects highlighted by RUM data, ensuring comprehensive issue resolution and ongoing performance optimization.
Conclusion:
Synthetic monitoring is a powerful tool for maintaining and improving your website’s performance. By simulating user interactions and continuously testing from various locations, synthetic monitoring helps you stay ahead of potential issues, optimize your site for different user segments, and ensure a smooth, fast user experience. When combined with real user monitoring, synthetic monitoring provides a comprehensive view of your site’s performance, enabling you to deliver the best possible experience to your users.
Investing in synthetic monitoring tools and incorporating them into your performance strategy is a proactive step towards ensuring your digital presence is reliable, fast, and competitive.
