Here at Nestify, we’ve come a long way from hosting a handful of websites for our close friends and family to now managing tens of thousands of sites spanning five continents. Like many tech-savvy companies, we’ve harnessed the power of the cloud from the get-go to fuel our expansion. Over time, we’ve evolved from a single EC2 instance for the Nestify dashboard to an impressive fleet of instances, databases, storage buckets, internet gateways, and CDN distributions scattered across various regions.
In our early days, AWS was a no-brainer. It offered us a global reach, flexibility, and a sweet spot between cost and performance. So, it was only natural that we chose AWS to host our customers’ WordPress sites as well.
When AWS rolled out their Graviton2 processors, we couldn’t resist giving them a spin. And guess what? We noticed a whopping 30% performance boost across our workloads. As Nestify continued to grow, we began hosting increasingly larger WordPress sites, which brought some hard-to-ignore bottlenecks into the spotlight.
AWS Bottlenecks
One of the major speed bumps we’ve encountered with AWS is the pace of storage. Each EC2 instance leans heavily on EBS (Elastic Block Storage) volumes for its storage needs. And as with all things AWS, there are various knobs and dials you can adjust to fine-tune the storage performance. But here’s the kicker – AWS doesn’t exactly broadcast on their pricing page that the EBS volumes have firm caps on IOPS and throughput for their general-purpose (gp2 and gp3) volumes.
IOPS, or Input/Output Operations Per Second, is a common performance measurement used to benchmark computer storage devices like hard disk drives (HDD), solid state drives (SSD), and storage area networks. Essentially, IOPS gives us an idea of how quickly a storage system can read and write data.
On the other hand, network storage throughput refers to the speed at which data is transferred from one location to another. It’s a measure of the volume of data that can pass through a network or interface at any given time. High throughput is desirable as it means data can be moved swiftly and efficiently, which is crucial for operations that involve large amounts of data.
So, when we talk about the limits on IOPS and throughput for AWS’s general-purpose volumes, we’re referring to the maximum speed and volume of data that can be read from or written to these storage volumes. These limits can impact the overall performance of applications and websites hosted on these volumes.
It’s only when you roll up your sleeves and delve into the nitty-gritty of the documentation that these limits come to light.
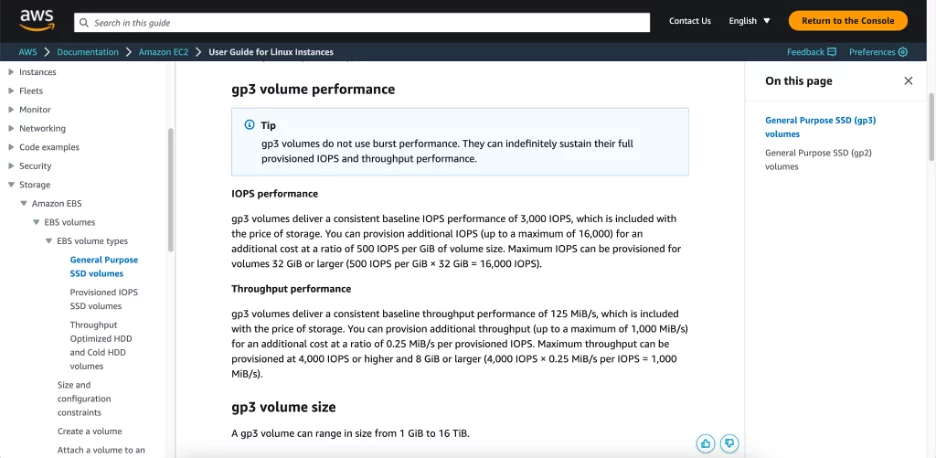
For some of our larger clients and bustling e-commerce sites, we began bumping into these limits more often than not. This led to sluggish response times for PHP and MySQL transactions, forcing us to scale out horizontally just to distribute the disk I/O operations across multiple instances. While this was a breeze for PHP, it was a whole different ball game for MySQL. Spreading write operations across multiple nodes proved to be a tough nut to crack, and not all of our customers had the budget to tackle it.
We considered switching gears to provisioned IOPS volumes (io1 and io2), but the costs started to skyrocket, exceeding $1000 per month for just 1 TB of storage. Since this didn’t make financial sense for us, we decided to put the idea of these volumes on the back burner and began exploring other options.
Other bottlenecks included costly bandwidth, limited options for high-frequency CPUs, and fewer choices of precompiled software for the Arm64-based Graviton processors.
Exploring Vultr
Vultr had been on our watchlist for some time and had popped up in our chats with customers on more than one occasion. With their expanding range of products and a global data center footprint, we thought it was high time to put Vultr to the test as a potential AWS alternative.
Testing methodology
To closely simulate real-world server usage, we decided to go with Unixbench (https://github.com/kdlucas/byte-unixbench). UnixBench was first started in 1983 at Monash University, as a simple synthetic benchmarking application. It was then taken and expanded by Byte Magazine.
The purpose of UnixBench is to provide a basic indicator of the performance of a Unix-like system; hence, multiple tests are used to test various aspects of the system’s performance. These test results are then compared to the scores from a baseline system to produce an index value, which is generally easier to handle than the raw scores. The entire set of index values is then combined to make an overall index for the system.
Since all of our infrastructure runs on Linux, this was a decent option. Unixbench is designed to measure the following:
- The performance of the server when running a single task
- The performance of the server when running multiple tasks
- The gain from the server’s implementation of parallel processing
Apart from CPU benchmarks, Unixbench also measures the performance of complex shell scripts, and file operations including random read and write operations, and system call overheads.
Since hosting WordPress sites at scale involves all of the above, Unixbench provides a decent idea of what real-world performance will look like on any server.
Unixbench report includes a system benchmark score that ranges from a few hundred to thousands. A higher score correlates to better server performance.
Testing Setup
We launched new cloud instances with default options on AWS and Vultr. Both instances ran Ubuntu 22.04 and had the following specs:
AWS EC2:
Instance Type: m6g.xlarge
CPU Cores: 4
Memory: 16 GB
EBS Volume: 384GB gp3 volume with default iops and throughput
Vultr:
Instance Type: Intel High Frequency 512 GB NVMe
CPU Cores: 4
Memory: 16 GB
Storage: 384 GB NVMe
Test results
Unixbench conducts two types of tests. Initially, it runs a single copy of each test that employs just one CPU core. Following that, it runs multiple tests simultaneously, the number of which depends on the server’s core count. The results from the single-core test give us a snapshot of the server’s baseline performance. A higher score here indicates that the server can swiftly handle tasks that are heavy on resources. The results from the multi-core tests, on the other hand, give us a sense of the server’s speed under the strain of heavy traffic.
In the context of WordPress, the single-core score is relevant to operations within the wp-admin, processing of scheduled tasks, WooCommerce reports, and so on. Meanwhile, the parallel core score is indicative of the server’s ability to manage heavy traffic, uncached requests, logged-in users, and the like.
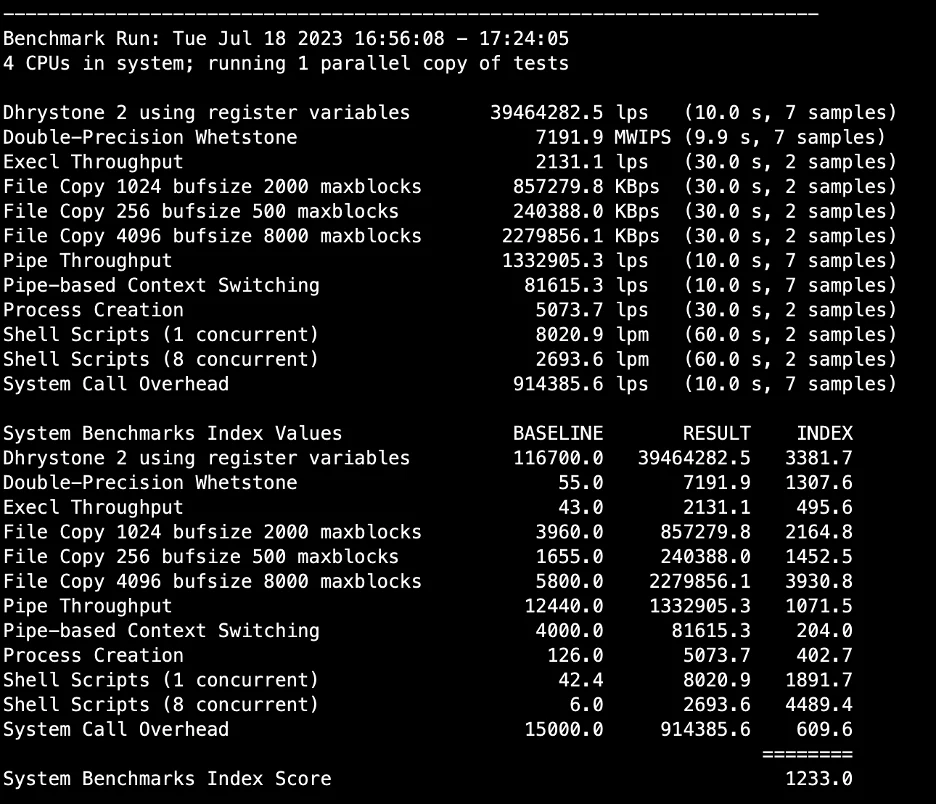
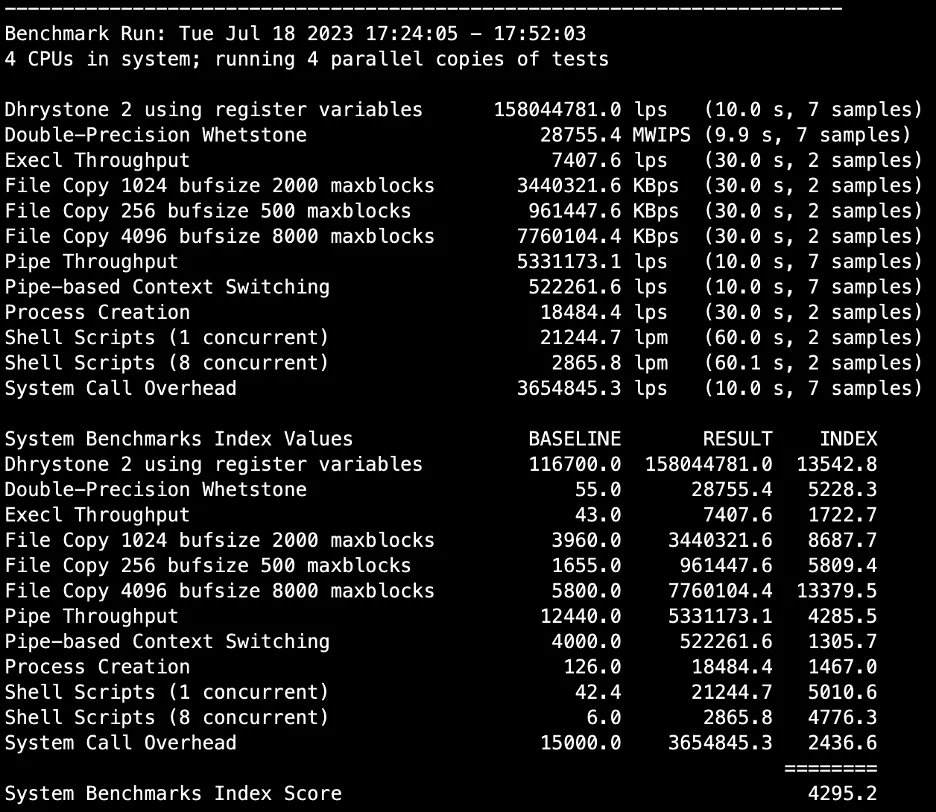
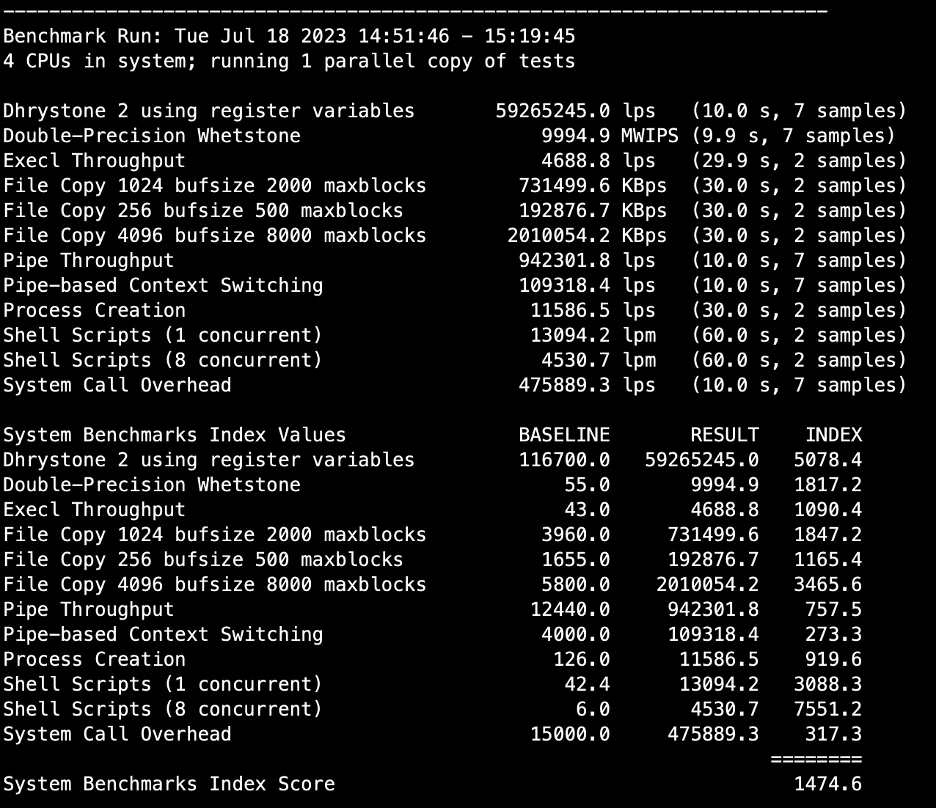
Here’s a look at the Unixbench test results from both instances, first running on a single core and then flexing their muscles on eight cores.
AWS Benchmark running on 1 core:
AWS Benchmark running on all 4 cores in parallel:
Vultr benchmark running on 1 core:
Vultr benchmarks running on 4 cores:
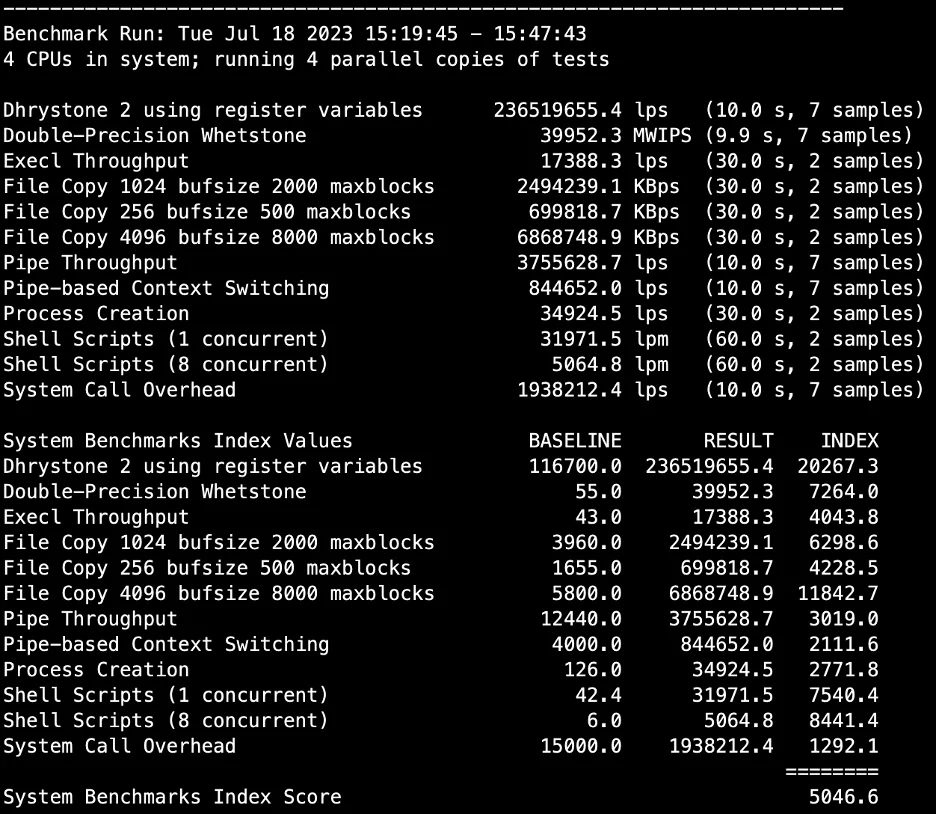
The test results revealed that the Vultr instance put on a stellar performance, particularly in process creation, shell scripts, and maintaining a low system call overhead. These are the aspects that a web server leans on most heavily. The overall score also pointed to the Vultr instance outpacing the EC2 by a notable 17.5%.
Real-World Tests
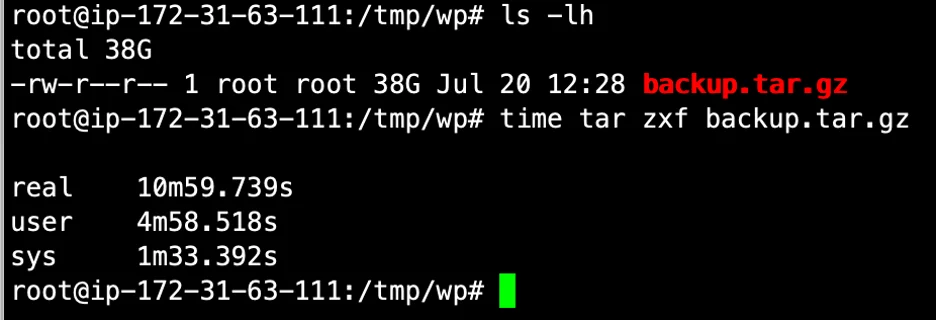
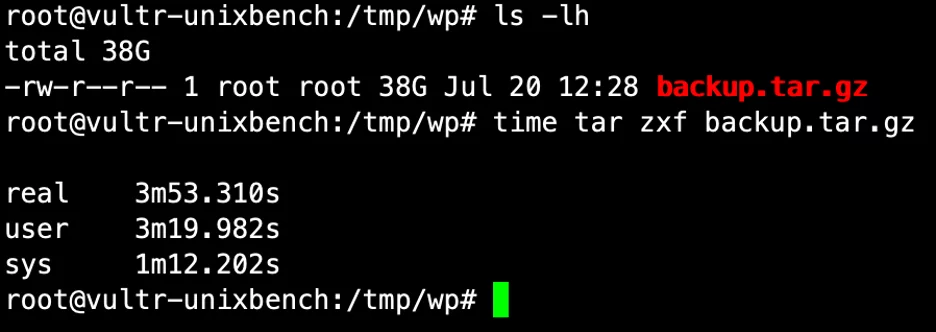
While benchmark scores offer a fantastic high-level comparison between instances, they can’t hold a candle to real-world testing, like migrating a massive WordPress site. So, up next, we’ll be extracting a hefty 38 GB backup on both instances and timing how long it takes.
AWS:
Vultr:
Next, we import the 3.4 GB mysql database.
AWS:

Vultr:

Finally we create a new backup from the 44 GB data on this site.
AWS:

Vultr:

The value we’re interested in is listed as ‘real’, which refers to the actual time spent on each task. As the screenshots illustrate, Vultr raced through each task two to three times faster than AWS. Given the number of WordPress migrations we handle daily, this speed difference isn’t just a minor improvement—it’s a significant boost that translates into substantial time savings.
Time spent on each task (Lower is better):
| Provider | Extract backup | Import SQL | Create Backup |
| AWS | 635.4 Seconds | 488.4 Seconds | 1765.8 Seconds |
| Vultr | 211.8 Seconds | 249.6 Seconds | 960 Seconds |
Result Comparison
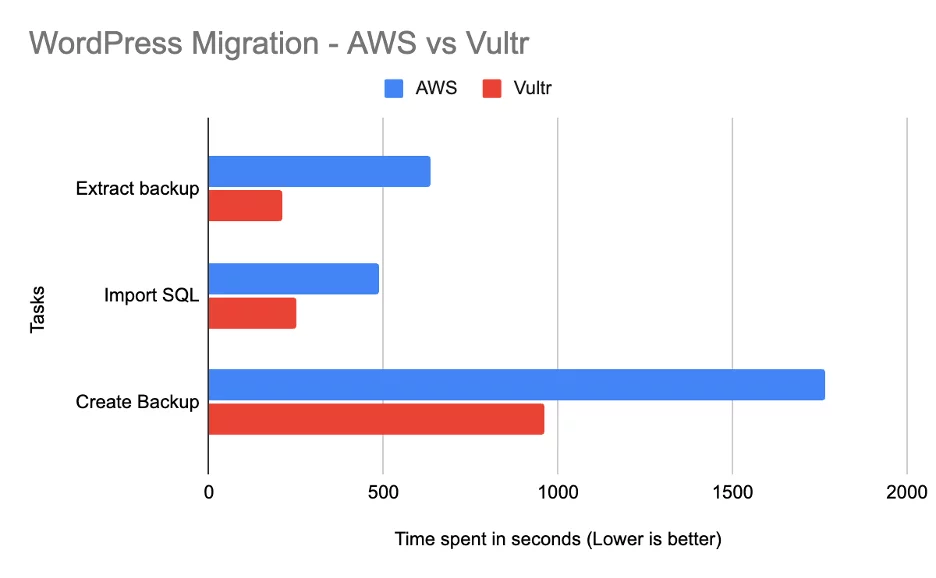
When we stack the results up against each other, it becomes crystal clear that Vultr is the front-runner.
In conclusion, after putting both platforms through their paces, Vultr emerges as the clear winner. From process creation to handling heavy traffic, Vultr consistently outperformed AWS, often completing tasks two to three times faster. This speed advantage, coupled with its predictable cost structure, makes Vultr an excellent choice for our needs. It’s not just about the numbers on a benchmark test, but the real-world implications of these results. The time savings and performance boost we’ve seen with Vultr translate into a smoother, faster experience for our clients and their WordPress sites. Given these compelling results, Vultr is the obvious choice for us as we continue to strive for the best possible service for our customers.
Looking to spin up your own Vultr server for WordPress? Click here to get started for FREE.


