
The infographic format is often associated with several drawbacks, many of which detract from its effectiveness.
Tall and narrow infographics can overwhelm viewers, exceeding their attention spans. Additionally, infographics crafted by inexperienced designers may feature visualizations that are difficult to interpret.
Some infographics are created solely for the purpose of generating links, lacking meaningful content. Moreover, certain topics are poorly suited for presentation in image form and would be better conveyed through structured textual formats.
What Entails Bad Infographics?
#1: Overabundance of Text

Source: Easilly
Infographics, which combine text and visuals, should strike a delicate balance to engage readers effectively. When text dominates, the infographic loses its visual appeal and begins to resemble a blog with images.
Text overload impedes viewers from comprehensively absorbing the information presented. Instead, text should be strategically positioned to complement the visuals.
Common text pitfalls in infographics include:
- Lengthy, convoluted sentences
- Extended paragraphs
- Disconnected text unrelated to the visuals
- Superfluous words or filler content
While text is crucial to convey information in an infographic, it should be concise and informative. Assume that readers will skim the graphic, so prioritize critical data to catch their attention.
Each line of text should serve a purpose, such as:
- Simplifying and highlighting data
- Enhancing readability with essential details
- Supporting visual illustrations
For instance, an example of text overload might read:
To improve readability and ensure the infographic remains scannable, critical points should be presented concisely using strong fonts and bullet points.
#2: Inaccurate Charts
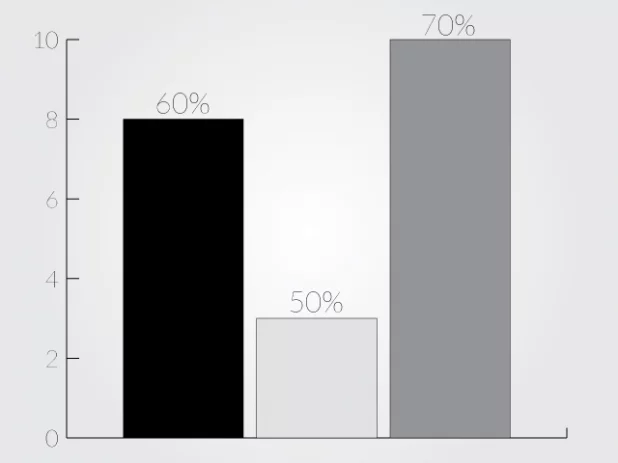
Inaccurate or poorly crafted charts can significantly undermine the effectiveness of an infographic’s message.
If charts are utilized in the infographic, meticulous attention should be devoted to ensuring their accuracy.
Charts serve as valuable tools for conveying trends, relationships between variables, and status reports. Therefore, it’s imperative to meticulously proofread any charts before publication.
Tips for creating impactful charts include:
- Tailor the chart to resonate with the intended audience; consider using pie charts or bar graphs for consumers and line charts for business professionals.
- Utilize vibrant colors to make key elements stand out.
- Employ clear labels and icons to aid reader comprehension.
- Whenever possible, incorporate interactivity or animation to enhance engagement.
- Double- and triple-check the data to maintain reader trust and coherence with other information presented.
#3: Lack of Coherent Narrative
Effective infographics should convey a coherent narrative that resonates with the audience. Begin by reviewing the content you intend to present on the infographic.
- Streamline the Content: Consider filtering out unnecessary information to maintain a cohesive storyline. Avoid veering off-topic; stick to a narrative that aligns with the infographic’s central theme. For instance, if the focus is on oranges, refrain from discussing apples to maintain narrative clarity.
- Audience Consideration: Tailor the narrative to appeal to the specific interests and preferences of your target audience. Whether it’s stakeholders or stay-at-home moms, understanding the audience enables the development of a compelling theme.
- Crafting the Narrative: Outline the beginning, middle, and end of the story to structure the infographic effectively. Keep the text concise yet engaging, incorporating data, insights, and attention-grabbing headlines. Prioritizing the narrative’s coherence ensures seamless flow and sustained interest.
#4: Irrelevance to Target Audience
Engaging your audience is paramount to encourage sharing and interaction with the infographic. Ensure that every aspect of the infographic, including text, narrative, and visuals, resonates with your audience’s interests and preferences.
Avoid Generalizations: Tailor the content to cater specifically to your target demographic. Providing irrelevant information, such as retirement account data to teenagers, diminishes engagement and undermines the infographic’s effectiveness.
Align with Audience Interests: Ensure that the infographic’s subject matter captivates and informs your audience effectively. By addressing topics of relevance and interest, you enhance engagement and retention.
#5: Generic Design
Infographics should stand out amidst the abundance of content online, necessitating unique and visually compelling designs. Avoid generic appearances by incorporating distinctive layouts, vibrant colors, and captivating visuals.
- Elements of Engaging Design: Opt for colorful visuals that command attention while maintaining coherence with the overall theme. Select illustrations and graphics that resonate with your target audience, incorporating humor where appropriate.
- Unique Templates: Choose templates that align with your audience’s preferences and the infographic’s space requirements. Prioritize selecting templates that offer a visually appealing layout and complement your content effectively.
- Eye-Catching Headlines: Craft concise headlines that serve as focal points and entice readers to engage with the infographic. Keep headlines succinct, ensuring they remain attention-grabbing and informative.
- Competitor Analysis: Research competitor infographics to identify design trends and areas for improvement. Leveraging insights from competitors enables you to create a standout infographic that surpasses existing standards.
#6: Inadequate Sourcing
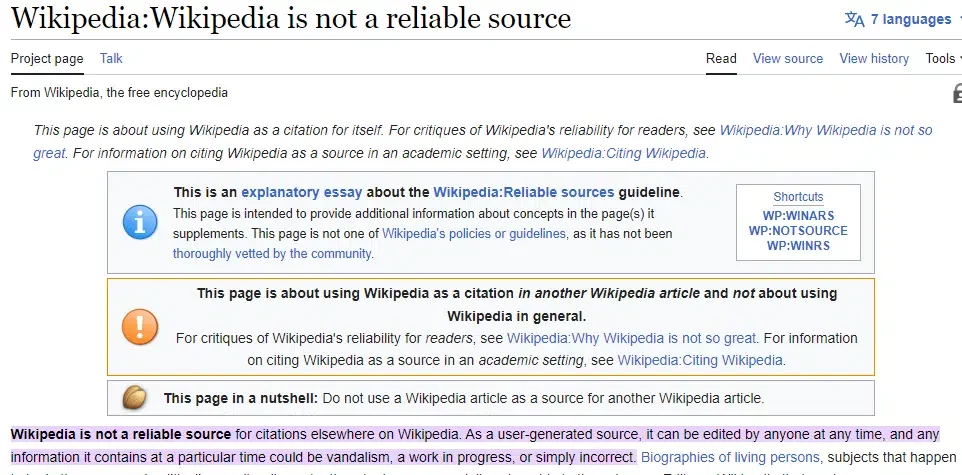
Ensuring the accuracy and reliability of information is essential for maintaining the credibility of an infographic. Prioritize reputable sources and cite them appropriately to uphold the integrity of the content.
Key Considerations for Sourcing: Refer to primary sources whenever possible to verify information accuracy and authenticity. Avoid relying solely on secondary or tertiary sources for critical data.
- Relevance and Authority: Select sources that are relevant to the infographic’s topic and hold authority within their respective fields. Prioritize reputable sources such as educational institutions, government entities, industry organizations, and influential figures.
By adhering to rigorous sourcing practices, you can enhance the credibility and trustworthiness of your infographic, thereby maximizing its impact on the audience.
Best Practices to Create Engaging Infographics:
1. Utilize Top-notch Infographic Maker Software
Crafting an infographic requires dedication and a touch of creativity, but fortunately, there’s a plethora of user-friendly tools available to streamline the process. These platforms empower users to design visually captivating infographics without the need for advanced design skills. Here are some of the top-rated software options:
- Canva: Renowned for its extensive library of over 100 downloadable templates catering to various themes like Business, Charity, and Education. Canva’s intuitive editor offers a plethora of customization options, making infographic creation a breeze.
- Crello (now VistaCreate): Boasting a staggering collection of over 50,000 downloadable templates, including both static and animated designs. Ideal for crafting visual content tailored for social media, web, print marketing materials, and advertisements.
- Piktochart: A versatile web-based infographic tool featuring 35 downloadable templates. Piktochart’s editor is equipped with an array of tools, enabling users to seamlessly embed videos, charts, and maps into their infographics.
- Lunacy: A free software available for Windows, macOS, and Linux, offering support in 18 languages. With a user-friendly interface and a vast selection of high-quality illustrations, icons, and shapes, Lunacy simplifies infographic creation for users of all skill levels.
Additionally, familiarizing yourself with established design principles employed by leading brands can further enhance the visual appeal and effectiveness of your infographics. Learning from tried-and-true design systems can provide valuable insights and inspiration for creating captivating visual content.
2. Understand the Varieties of Infographics and Their Appropriate Applications
Infographics serve as potent tools for visually presenting data, but selecting the right type of infographic is crucial, as each serves distinct purposes tailored to specific communication needs. Familiarizing yourself with the various types of infographics and their respective applications is essential for effective utilization in marketing endeavors. Here are seven types to consider:
- Statistical Infographic: Ideal for visualizing survey findings, displaying data from diverse sources, or bolstering arguments with relevant statistics.
- Informational Infographic: Communicates new or specialized concepts, offering comprehensive overviews of subjects.
- Timeline Infographic: Helps visualize historical timelines, highlight significant dates, or provide chronological overviews.
- Process Infographic: Outlines the steps involved in a process, facilitating clear understanding and guidance.
- Comparison Infographic: Useful for presenting unbiased comparisons between options or enhancing the appeal of a particular choice.
- Hierarchical Infographic: Organizes information based on hierarchical structures, ranking items from greatest to least.
- List Infographic: Shares lists of tips, resources, or examples in a concise and visually appealing manner.
Moreover, infographics can be structured in various formats to enhance their effectiveness:
- Timelines: Effective for illustrating historical events or complex processes’ evolution over time.
- Charts and Graphs: Utilized in informational infographics to visually represent data trends, such as using pie charts to depict product or service usage frequencies.
- Maps: Offer insightful depictions of geographical data, ranging from disease spread patterns to animal migration routes.
3. Assess Essential Attributes for Your Infographic’s Success
While preferences vary among audiences, certain fundamental elements contribute to an infographic’s impact and shareability. Here are key factors to consider when crafting a compelling infographic:
- Problem-Solving Content: Address a pertinent issue or provide valuable insights to captivate audience interest.
- Superior Design: Ensure visually appealing layouts and graphics to enhance comprehension and engagement.
- Educational and Entertaining: Blend informative content with entertaining elements to sustain audience interest.
- Statistical Data: Incorporate relevant statistics to substantiate claims and add credibility to the infographic.
- Proper Sourcing: Cite credible sources to validate information and uphold the infographic’s integrity.
4. Understand Your Audience and Objectives
Creating engaging and informative infographics requires a deep understanding of your audience and objectives. It’s essential to craft infographics that resonate with your target audience and align with your goals seamlessly.
Consider the following questions:
- Who is your target audience?
- What are their demographics, such as age and gender?
- Will your infographic cater to a specific age group or gender?
- What do you aim for your audience to take away from your infographic?
Your target audience will dictate the data you incorporate, the tone and language you use, the overall design style, and the level of detail required. Once you’ve identified your audience, focus on defining your goals and determining the information you want to convey through your infographic.
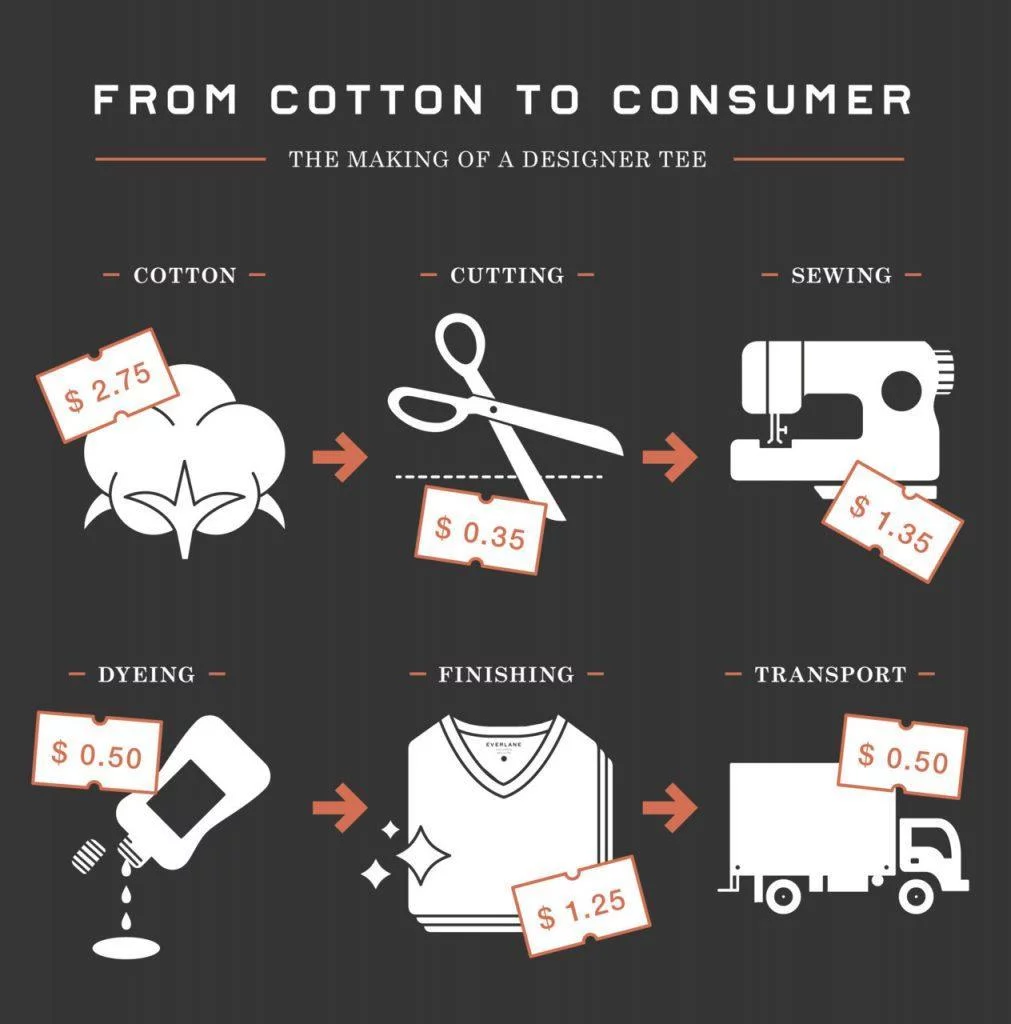
For example, Everlane created an infographic illustrating why clothing prices may exceed expectations. The infographic breaks down the production process of a basic t-shirt and highlights associated costs. It then elucidates how companies factor in pricing and sell products at higher rates than necessary.
5. Gather Relevant Data
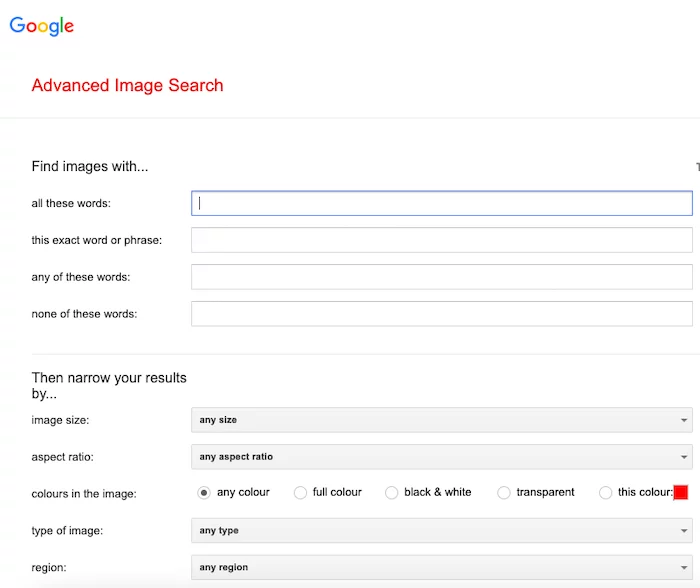
Data serves as the backbone of compelling infographics, providing factual support and depth to your narrative. Gathering data is relatively straightforward, with abundant resources available online.
Utilize various platforms and repositories to access public data, market research findings, and relevant statistics. Sources like Pew Research, Harvard Business Review, Statista, and Google Trends Datastore offer valuable insights and datasets.
When sourcing data, adhere to the following guidelines:
- Rely on credible sources, such as academic journals, government statistics, and reputable studies.
- Attribute the data to its source, ensuring transparency and credibility.
- Ensure data accuracy and currency, avoiding outdated or unreliable information that may undermine the infographic’s credibility.
6. Develop a Content Outline and Layout Template
When embarking on creating an infographic, it’s crucial to outline the content structure you intend to incorporate. An effective infographic conveys a clear message and utilizes headings, subheadings, and callouts to facilitate easy information retrieval for readers.
Your outline should encompass:
- The overarching story you aim to convey — what is the primary message?
- Key points you want to emphasize — what takeaways do you want readers to grasp?
- A compilation of relevant facts and statistics to substantiate your message.
- Selection of fonts and color palette.
- Reference examples of infographics for inspiration.
- Channels for promoting your infographic.
Following this, crafting a template layout becomes imperative. When devising a design intended for replication or online sharing, creating a template streamlines dissemination across various platforms such as social media, blogs, and websites.
Utilizing infographic templates expedites the creation process unless opting for a bespoke design from scratch. Choose a template aligned with the type of information you aim to communicate.
7. Incorporate Your Brand Identity
Failing to integrate your logo or company name into your infographic could be a missed branding opportunity. Placing them strategically at the top and bottom enhances brand visibility and recognition.
An illustration of this is depicted below:
8. Adhere to Infographic Design Best Practices
Adhering to the best practices of infographic design is paramount to achieving optimal results. Below are actionable tips to craft infographics that drive traffic, enhance SEO, and captivate your audience, fostering repeat engagement:
- Utilize a single font for headlines and another for body text.
- Opt for a color palette featuring a primary color along with two to three secondary colors.
- Include a neutral color to complement the palette.
- Ensure consistency in style and color of icons.
- Segment the infographic into two columns with a prominent title card atop.
- Maintain simplicity in chart design, adhering to the chosen color palette and incorporating clear labels.
- Incorporate ample white space around headlines and between sections to enhance readability.
- Organize the infographic into specific sections based on the topic, alternating colors and utilizing visual elements consistently.
- Post completion, review the alignment of main elements and spacing for coherence.
Visual aesthetics play a pivotal role, underscoring the importance of visual content marketing. Consider employing photo manipulations, 3D tools, compositing, and drawing techniques to craft an aesthetic that resonates with your audience.
9. Put Yourself in the Reader’s Shoes
During the creation process of your infographic, adopt the perspective of a reader. Your infographic should serve a purpose for your audience, addressing their needs or solving a problem they may have. Consider how your infographic can provide value to them. If it fails to capture your interest as a creator, it’s unlikely to captivate your audience.
Visualize how your infographic will appear to readers upon receipt. Envision what elements will catch their eye, both in terms of words and images. Pose questions such as: What will draw their attention? What aspects will resonate with them? Utilize these inquiries as guiding principles when making design choices.
10. Foster Creativity and Originality
Infographics offer an avenue for unleashing creativity in your marketing endeavors, but it’s crucial to steer clear of creating generic content that blends in with the rest. Standout infographics possess a distinct style and ambiance.
Consider the following infographic as an example:
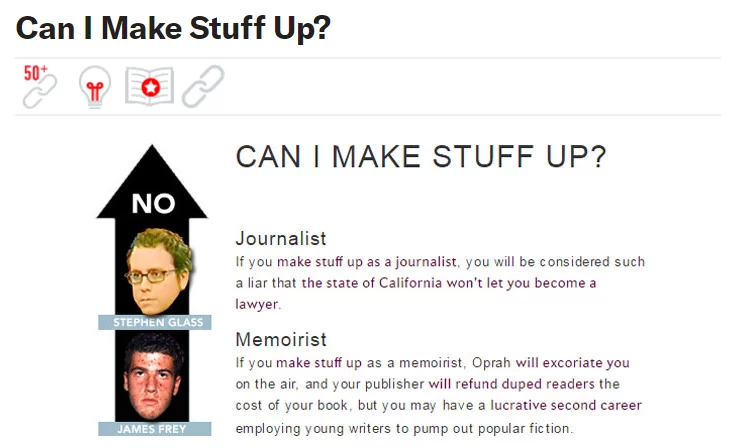
This infographic ingeniously portrays the acceptability of fabrication across various professions, ranging from journalists to fantasy writers. It presents an original concept, further enhanced by visually engaging elements.
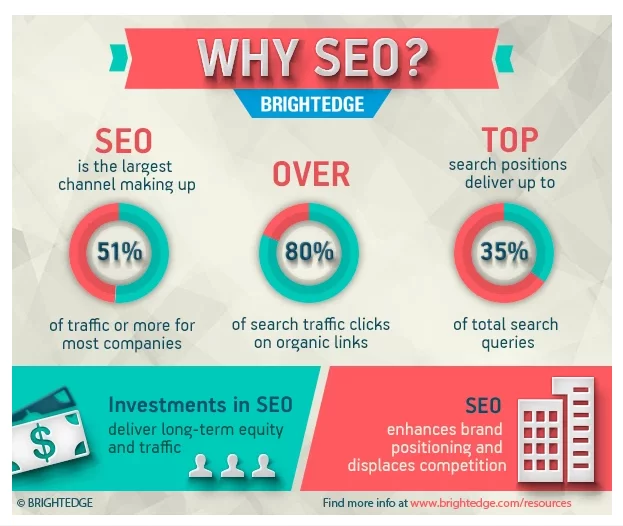
11. Harness the Power of Maps and Charts
Incorporating relevant maps and charts to illustrate facts can lend credibility and support to your infographics. Research indicates an 80% increase in readership rates when content utilizes visual aids such as charts, graphs, images, and color schemes.
For instance, consider this example showcasing the distribution of the world’s resources by country:
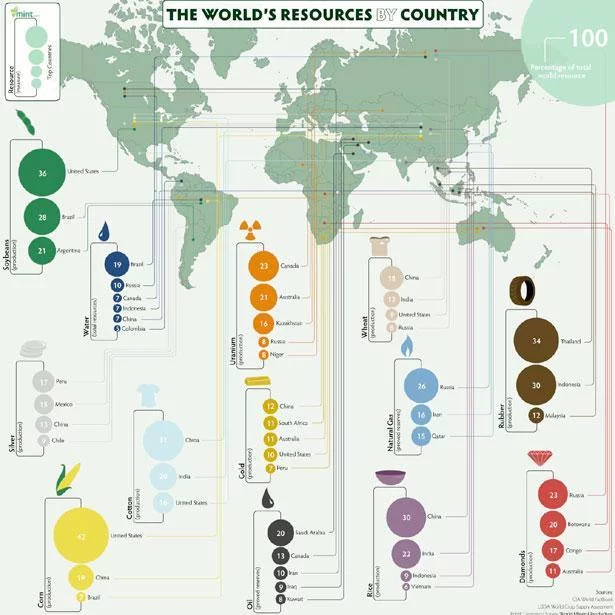
This infographic effectively utilizes maps and charts to visually convey data, enhancing comprehension and engagement.
12. Amplify Infographic Promotion Efforts
To maximize the reach of your infographic, implement the following strategies:
- Forge connections and outreach to influential bloggers who can share your content with their audience. Encourage your subscribers to promote the infographic on their blogs, utilizing tools like embed tweet or Click to Tweet. Studies indicate that infographics receive three times more shares compared to other content types.
- Leverage social media platforms to disseminate your infographic to a wider audience. Compose a compelling press release to garner attention and coverage. Submit your infographic to directories dedicated to promoting visual content, such as Daily Infographic, Visual.ly, and Infographic Journal. These platforms specialize in amplifying the reach of infographics.
Conclusion:
Infographics have been recognized as an art form for years, and their popularity on the internet continues to soar as a novel method of presenting information. They serve as a straightforward yet impactful tool to distinguish your brand and enhance its memorability, potentially leading to increased success. However, before diving into infographic creation, it’s imperative to ensure that your idea is well-conceived.
FAQs on Infographics:
Why are infographics popular on the internet?
Infographics offer a visually appealing and concise way to convey information, making them highly shareable and engaging for online audiences.
How can infographics benefit my brand?
Infographics can help your brand stand out from competitors, increase brand awareness, and effectively communicate complex information to your target audience.
What should I consider before creating an infographic?
Before creating an infographic, clearly define your objectives and the message you want to convey. Ensure that your idea is precise and focused to effectively communicate with your audience.
What are some tips for creating an eye-catching infographic?
Utilize visually appealing design elements, such as vibrant colors, clear typography, and relevant imagery. Keep the content concise and organized, focusing on key points to maintain viewer engagement.
How can I ensure that my infographic resonates with my audience?
Tailor your infographic content to address the needs and interests of your target audience. Use language and visuals that resonate with them, and consider incorporating data or statistics relevant to their preferences or demographics.
