
In today’s fast-paced digital age, keeping your computer systems running smoothly is more crucial than ever. Whether you’re managing a personal gaming rig, a network of office workstations, or an expansive IT infrastructure, ensuring your hardware operates at its peak can save you time, money, and a whole lot of headaches. This is where the best hardware monitor tools come in to save the day.
The best hardware monitor tools are your computer’s personal health checkup, constantly keeping an eye on the physical state of your system. These smart applications tap into embedded sensors across your hardware—monitoring components like the CPU, motherboard, RAM, fans, and power supply. They provide you with live data on everything from temperature and voltage levels to fan speed and power usage. By tracking these vital metrics in real time, these tools allow you to spot issues before they snowball into catastrophic failures that could lead to system crashes, costly repairs, or unexpected downtime
What Are Hardware Monitoring Tools?
Hardware monitoring tools are essential software applications that help keep an eye on the physical components of a computer system, providing real-time insights into system health and performance. These tools interface with sensors embedded in hardware like the motherboard, CPU, fans, and other critical components, collecting data on various physical attributes such as temperature, voltage levels, fan speeds, and power consumption.
The primary function of a hardware monitoring software is to retrieve data from these sensors and present it in an intuitive, easy-to-understand format. By doing so, it enables users to monitor the health of their systems, ensuring they remain within safe operational parameters and avoid potential issues like overheating, power fluctuations, or hardware failure. For example, a monitoring tool might show you the temperature of your CPU, the voltage on your motherboard, or the speed of your system fans, all of which can be critical to maintaining optimal performance.
Learn about patch management for security systems here.
Real-Time Performance: How the Best Hardware Monitors Help You Stay Ahead
1. Real-Time Monitoring for Proactive Issue Detection
One of the most important benefits of hardware monitoring tools is their ability to provide real-time monitoring of your system’s physical health. These tools continuously gather data from sensors embedded in various hardware components such as the CPU, motherboard, memory, and power supply.
With constant access to real-time data, users can identify any fluctuations or irregularities—such as temperature spikes, voltage inconsistencies, or fan malfunctions—before they develop into critical problems. Early detection allows for swift corrective action, often preventing costly downtime and reducing the risk of permanent hardware damage.
For example, a sudden rise in CPU temperature could indicate poor cooling or a malfunctioning fan, and addressing it immediately can save the system from overheating and failure. By catching problems early, these tools help maintain system reliability and continuity of operations, crucial for both businesses and individuals who rely on their systems for day-to-day activities.
2. User-Friendly Interface for Easy Interpretation
Computer hardware monitoring softwares are designed with user-friendly interfaces that present data in an easy-to-understand format. This typically includes visual representations such as graphs, charts, alerts, and numerical values that display key metrics like temperature, fan speed, and voltage levels.
What makes these tools particularly valuable is their accessibility for both technical and non-technical users. While IT professionals can dig deeper into the raw data for more advanced analysis, casual users or business owners can easily interpret the system’s health at a glance. For instance, a simple green, yellow, or red indicator can signal whether the system is operating within normal parameters, making it easy for anyone to spot potential issues.
In addition, detailed graphs or real-time charts allow users to track the system’s performance over time, helping them understand trends and patterns. This visual clarity empowers users to make informed decisions about system maintenance, upgrades, or troubleshooting with minimal complexity.
3. Preventive Maintenance for Long-Term System Health
By continuously tracking important metrics like temperature, voltage, fan speeds, and power consumption, hardware monitoring softwares facilitate preventive maintenance. Rather than reacting to problems after they’ve already caused damage or downtime, these tools allow users to adopt a proactive approach to system health.
For example, if a system’s CPU temperature begins to rise above its recommended threshold, the tool will trigger an alert, allowing the user to take immediate action, such as cleaning dust from fans or adjusting the cooling system. This capability can also extend to power supply issues, where voltage fluctuations or power surges can lead to hardware failure if left unchecked. Monitoring tools help users stay ahead of such issues by providing early warnings before they escalate into more serious problems, ensuring that the system continues to operate smoothly without unexpected failures.
This proactive approach to maintenance not only increases the lifespan of the hardware but also minimizes the risk of unplanned downtime, which can be especially costly for businesses that rely on continuous operations.
4. System Optimization for Enhanced Efficiency
Another key benefit of computer hardware monitoring tools is their role in ensuring system optimization. These tools don’t just monitor health but also help improve performance by providing insights into key metrics such as power consumption, fan speeds, and system temperatures. By continuously tracking these factors, users can make adjustments to enhance overall system efficiency.
For example, hardware monitoring tools can alert users if the system is drawing more power than necessary or if the fans are running at inefficient speeds. By addressing these inefficiencies, users can optimize their systems to use power more effectively, reduce unnecessary heat generation, and extend the lifespan of critical components.
Additionally, by ensuring that system fans are running at the optimal speed and the CPU is operating within ideal temperature ranges, users can prevent performance throttling and ensure that their system is operating at peak performance.
Comparing the Best Hardware Monitor Softwares for Different Operating Systems
1. NinjaOne (Formerly NinjaRMM)
Best For:
Managed Service Providers (MSPs), IT service businesses, and small-to-medium businesses (SMBs) or mid-market companies with small IT teams.
Pricing:
NinjaOne offers a free trial for users to test its features. Pricing is based on a per-device model, and varies depending on the features and level of service required.
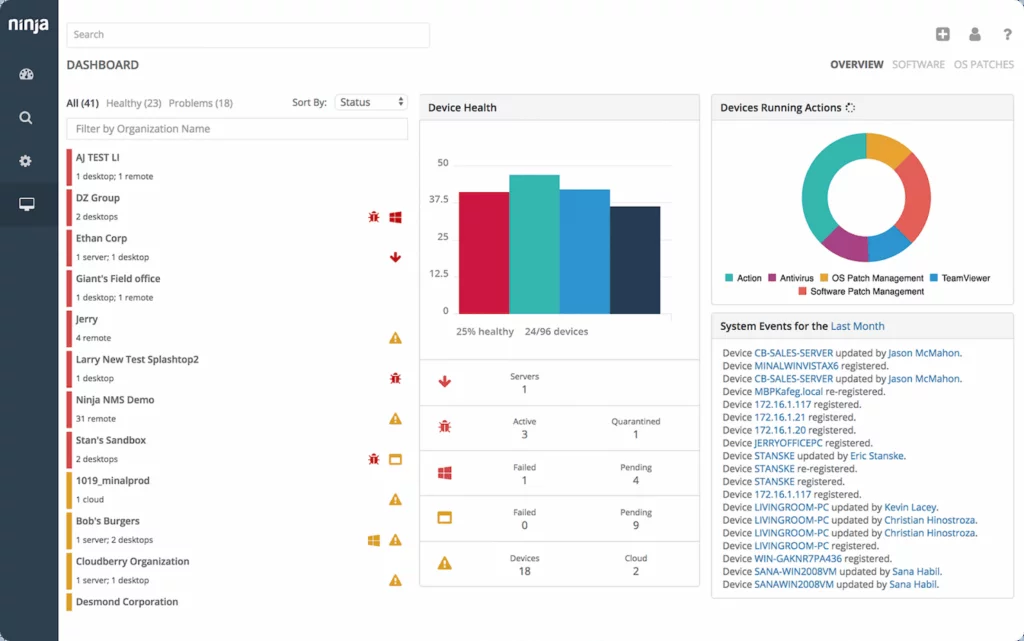
NinjaOne is an automated endpoint management platform designed to simplify and streamline IT operations for businesses of all sizes. With over 20,000 customers, it provides visibility, security, and control over all endpoints, making it especially ideal for MSPs, IT service providers, and organizations with small internal IT teams.
The platform is designed to automate many of the most time-consuming aspects of IT management, reducing the need for manual intervention while improving both productivity and security. NinjaOne integrates seamlessly with a wide array of IT and security tools, offering a robust, comprehensive solution for endpoint management.
With a strong focus on customer success, NinjaOne offers free, unlimited onboarding, training, and support, ensuring that users get the most out of the platform from the very start.
NinjaOne ranks #1 on G2 for endpoint management, patch management, remote monitoring and management, and mobile device management.
Key Features:
- Endpoint Monitoring: Monitor the health and productivity of all Windows and MacOS devices (workstations, laptops, and servers) from a single dashboard.
- Inventory Management: Get detailed hardware and software inventories for every device in your network.
- Remote Management: Remotely manage all devices without interrupting users, with a suite of powerful remote tools.
- Automated Patching: Automate OS and third-party application patching for both Windows and MacOS devices, ensuring systems are always up-to-date and secure.
- IT Automation: Standardize the deployment, configuration, and ongoing management of devices with IT automation tools that streamline workflows and reduce manual tasks.
- Remote Access: Directly take control of devices with remote access to troubleshoot, configure, or resolve issues without requiring physical access to the device.
Verdict:
NinjaOne is a powerful, intuitive IT monitoring and management platform that drives efficiency for IT teams and managed service providers. By automating critical tasks like patch management, device monitoring, and remote access, NinjaOne helps reduce the workload on IT staff, lower costs, and improve overall operational efficiency. Its ease of use, combined with robust support and training, has made it a favorite among IT professionals. Whether you’re managing a small team or a large fleet of endpoints, NinjaOne is designed to help you streamline IT operations, minimize downtime, and improve service delivery.
2) Paessler PRTG Network Monitor
Best For:
Small to large businesses seeking a comprehensive network monitoring solution.
Pricing:
Paessler offers a 30-day free trial for the unlimited version of PRTG Network Monitor. There is also a free version available, which is limited to 100 sensors. For more extensive monitoring, pricing starts at $2,149 for 500 sensors and 1 server installation. Custom pricing is available for larger deployments.
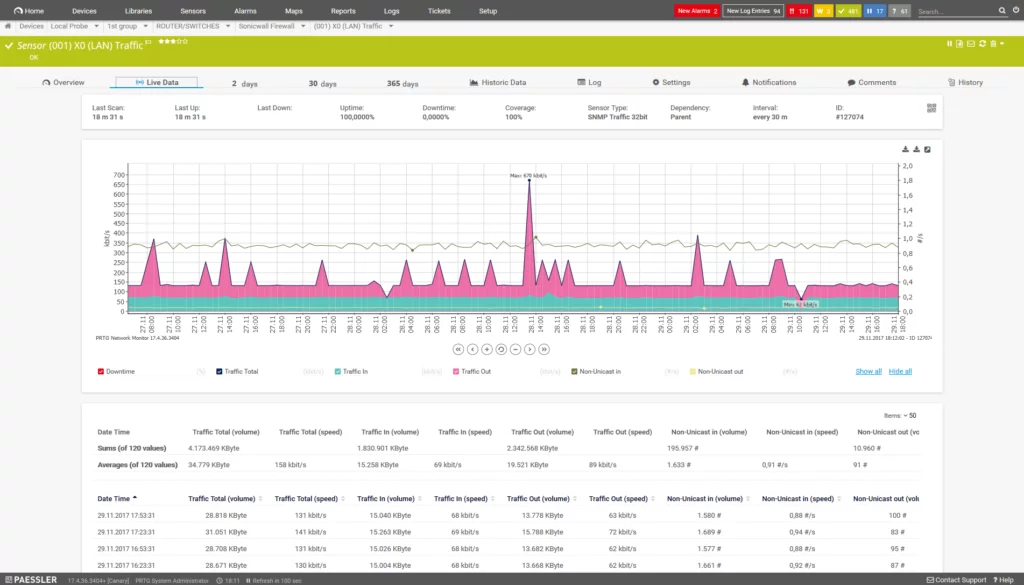
PRTG Network Monitor is a robust, all-in-one network monitoring solution designed to provide comprehensive visibility into the health and performance of your network infrastructure. It allows businesses of all sizes to monitor both on-premise and cloud-based systems from a single, centralized platform. PRTG is ideal for monitoring servers, network devices, and cloud services, and offers real-time monitoring of availability, capacity, accessibility, and reliability.
PRTG’s intuitive interface and easy configuration make it a powerful tool for IT teams, offering a high level of flexibility to adapt to various monitoring needs. With its extensive range of sensors, PRTG can monitor everything from bandwidth usage to specific data sets from databases, making it highly customizable to suit different business environments.
Key Features:
- Bandwidth Monitoring: Identify network bottlenecks and monitor the bandwidth usage of devices and applications to ensure optimal performance.
- Database Monitoring: Monitor specific data sets from databases, enabling you to keep track of performance and issues in real-time.
- Application Monitoring: Receive detailed statistics for applications running on your network, helping you spot performance issues early.
- Comprehensive Network Monitoring: Track your entire local network, including workstations, routers, switches, and more, ensuring no part of your infrastructure goes unmonitored.
- Cloud Monitoring: PRTG offers cloud monitoring capabilities, enabling businesses to monitor their cloud services and virtual environments centrally.
- Real-Time Alerts: Receive immediate alerts if any device or service experiences a performance issue, allowing for rapid response and issue resolution.
Verdict:
PRTG Network Monitor is a comprehensive, easy-to-use network monitoring solution that provides deep insights into your IT infrastructure. With its all-in-one approach, there’s no need for additional plugins, making it a streamlined option for businesses looking for a reliable network monitoring tool. It’s a powerful platform that provides detailed, real-time analytics for network devices, applications, traffic, and more, helping businesses ensure their IT systems run smoothly and efficiently.
Engine dashboard
#3) ManageEngine OpManager
Best For:
IT teams and businesses of all sizes looking for a versatile monitoring solution for network infrastructure.
Pricing:
OpManager offers Standard, Professional, and Enterprise editions. Pricing is customized based on the specific needs of the business, and interested customers need to contact ManageEngine for a personalized quote.
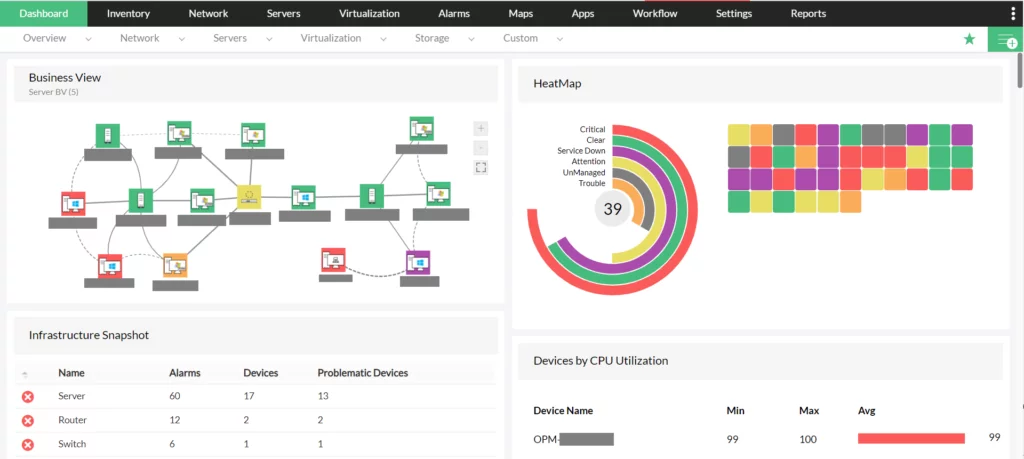
ManageEngine OpManager stands out as an excellent hardware monitoring solution, with a strong focus on monitoring not only network devices but also critical hardware components such as routers, printers, storage devices, and more. In addition to hardware monitoring, OpManager offers comprehensive visibility into your network infrastructure, including firewalls, wireless networks, and network performance.
OpManager provides real-time alerts on the health and performance of all hardware components, helping IT teams proactively address issues before they escalate into more significant problems. The platform’s fault management, network visualization, and distributed network monitoring capabilities make it a powerful tool for businesses managing complex networks.
Key Features:
- Continuous Network Monitoring: Monitor your network 24/7 for performance issues, bottlenecks, or downtime, ensuring network health at all times.
- Network Visualization: Gain a visual representation of your network topology, which helps IT teams quickly identify issues and their impact on the overall system.
- Fault Management: Proactively detect and resolve faults within your network infrastructure, minimizing downtime and improving reliability.
- Distributed Network Monitoring: If your network spans multiple locations, OpManager supports monitoring across distributed environments, ensuring full coverage and visibility.
Verdict:
OpManager is a powerful network monitoring solution that provides end-to-end visibility and analytics for all hardware devices on your network. It excels at monitoring both physical hardware and network components, making it an essential tool for IT teams looking to ensure the optimal performance of their network infrastructure. The platform is user-friendly, cost-effective, and particularly useful for identifying and addressing hardware issues before they cause major disruptions. Whether you’re managing a small or large network, OpManager’s robust set of features makes it a reliable choice for businesses seeking to improve network reliability and efficiency.
#4) HWMonitor
Best For:
Small to medium-sized businesses looking for a lightweight hardware monitoring tool.
Price:
- HWMonitor is available for free.
- HWMonitor Pro offers two licensing options:
- Standard License: $22.31
- Extended License: $39.10
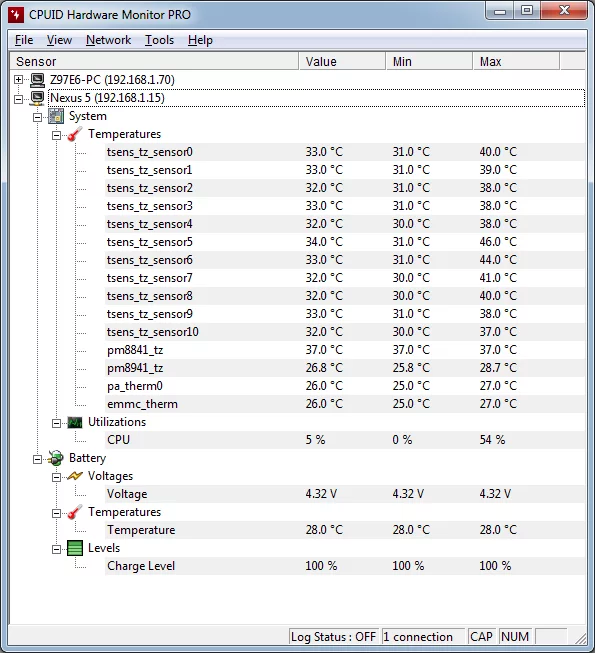
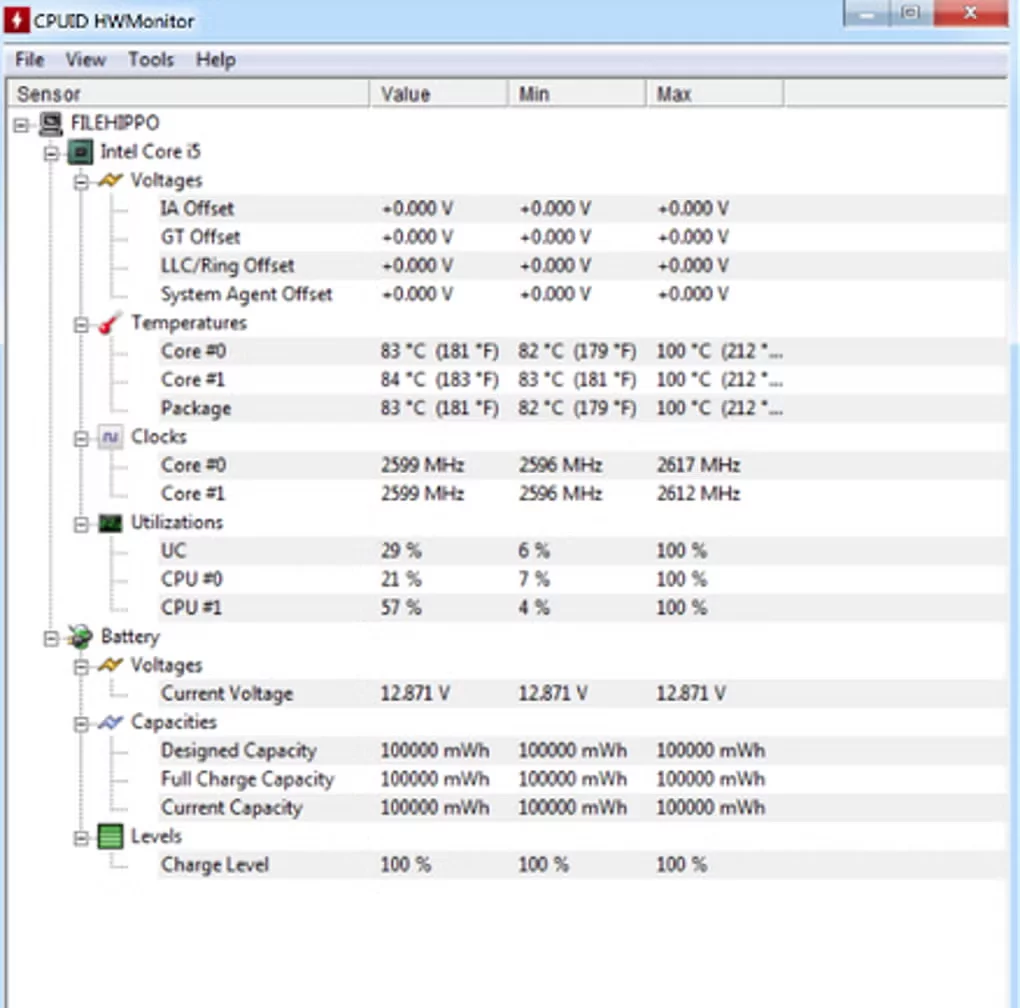
HWMonitor is a hardware monitoring program that tracks various critical system parameters, including voltages, temperatures, fan speeds, and clock speeds. It supports a wide range of hardware components, including CPUs, motherboards, graphics cards, and hard drives. HWMonitor also utilizes S.M.A.R.T. (Self-Monitoring, Analysis, and Reporting Technology) to read the temperature of hard drives, providing essential information on drive health. It is compatible with Windows operating systems and offers a Pro version with additional features.
HWMonitor is particularly appreciated for its simplicity and lightweight nature. For businesses that need a straightforward and low-resource monitoring tool, HWMonitor provides a reliable solution. The HWMonitor Pro version comes with enhanced capabilities, such as remote monitoring and graph generation, and is available for both Windows and Android devices.
Key Features:
- Real-Time Monitoring: Tracks voltages, temperatures, fan speeds, and clock speeds for a variety of hardware components.
- S.M.A.R.T. Support: Monitors the temperature of hard drives using the S.M.A.R.T. system, providing early warnings of potential drive failure.
- GPU Temperature Monitoring: Supports monitoring the GPU temperature for supported video cards, helping prevent overheating.
- HWMonitor Pro:
- Available for both Windows and Android platforms.
- Remote Monitoring: Monitors sensors on remote PCs or Android devices via TCP/IP connection.
- Graph Generator: Creates graphs for monitoring data, and allows you to log and track performance trends over time.
- Improved Interface: Offers an enhanced user interface for a more streamlined monitoring experience.
Verdict:
HWMonitor is an excellent choice for businesses seeking a simple yet effective hardware monitoring tool. Its free version provides core functionality, while the Pro version adds useful features such as remote monitoring and detailed graphical reports. HWMonitor is regularly updated, ensuring compatibility with newer hardware and offering ongoing improvements. It is lightweight, easy to use, and ideal for businesses that need a basic but reliable monitoring solution.
#5) Open Hardware Monitor
Price:
Free (Open-source software)
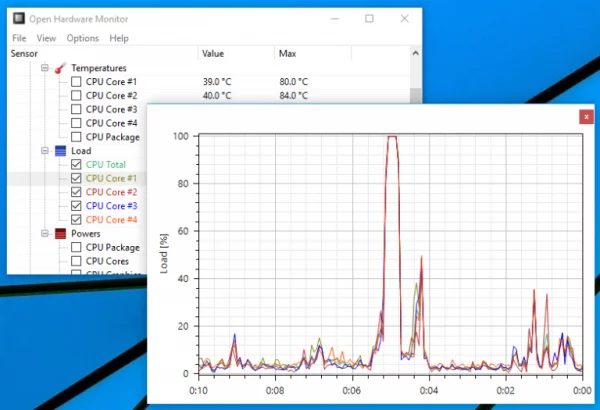
Open Hardware Monitor is a free, open-source software designed to monitor key hardware parameters such as temperature sensors, fan speeds, voltages, load, and clock speeds. It provides broad support for various hardware monitoring chips and sensors, making it a versatile tool for users looking for detailed insights into their system’s health. Open Hardware Monitor is compatible with most Intel and AMD processors and can monitor S.M.A.R.T. hard drives to track their temperature, giving users an understanding of both system and drive performance.
As an open-source solution, it offers businesses a cost-effective and transparent tool for monitoring their hardware. It is particularly useful for those who need basic system monitoring without the need for complex features or paid licensing.
Key Features:
- CPU Temperature Monitoring: Reads core temperature sensors of both Intel and AMD processors, enabling users to track CPU temperature in real-time.
- S.M.A.R.T. Support: Monitors the temperature of S.M.A.R.T.-enabled hard drives, helping prevent overheating and potential drive failure.
- Customizable Display: View monitored values in the main window, as a customizable desktop gadget, or directly from the system tray.
- Open-Source: Completely free and open-source software, which means users can customize it and access the source code if needed.
Verdict:
Open Hardware Monitor is a straightforward, open-source software that is free to use and offers reliable monitoring for key hardware metrics. It is especially suitable for businesses or individuals who want a no-cost solution to monitor basic system parameters like temperature, fan speed, and voltages. While it may not have the advanced features of paid solutions, it is user-friendly, lightweight, and perfect for small businesses or personal use.
#6) HWiNFO
Best For:
Small to large businesses requiring in-depth hardware analysis and real-time system monitoring.
Price:
Free (with additional paid versions for more advanced features)
HWiNFO is a comprehensive hardware analysis, monitoring, and reporting tool that provides detailed insights into your system’s hardware. It is suitable for businesses of all sizes looking to get a deep understanding of their computer components’ performance. The software provides real-time monitoring of system components and generates detailed reports for better decision-making and troubleshooting. HWiNFO supports both Windows and DOS operating systems and is especially useful for IT professionals and businesses managing complex hardware infrastructures.
The software provides accurate status monitoring of all system components, including processors, memory, storage devices, and more. It can predict potential failures, allowing businesses to take proactive steps in preventing system downtime. HWiNFO also offers a customizable interface, making it flexible for different monitoring needs.
Key Features:
- Comprehensive System Monitoring: Provides detailed real-time monitoring of all system components, such as CPU, RAM, GPU, motherboard, and storage devices.
- Failure Prediction: Offers predictive monitoring to identify potential hardware failures before they happen, reducing the risk of downtime.
- Customizable Interface: Allows users to tailor the interface to their needs, making it easier to view and interpret system health data.
- Reporting: Generates detailed system reports, logs, and status updates, helping users track long-term performance and identify issues.
- Hardware Identification: Can identify crucial hardware information, such as BIOS version, processor model, clock speed, and driver details.
Verdict:
HWiNFO is a highly detailed and powerful hardware monitoring tool that provides an extensive level of analysis for businesses looking to get deep insights into their IT infrastructure. It’s perfect for small to large businesses that need accurate, real-time monitoring and reporting of hardware performance. The software is easy to use and offers a highly customizable interface, making it ideal for IT professionals who need to monitor complex systems. The free version provides ample functionality, and the tool’s detailed reports make it invaluable for preventive maintenance and troubleshooting.
#7) AIDA64
Best For:
Small to medium-sized businesses and home users needing advanced diagnostics, system monitoring, and benchmarking.
Price:
AIDA64 offers four editions, each tailored to different use cases:
- AIDA64 Extreme: Starts at $39.95 for 3 PCs.
- AIDA64 Engineer: Starts at $199.90.
- AIDA64 Network Audit: Starts at $100 for 10 nodes.
- AIDA64 Business: Starts at $199 for 10 nodes.
A 30-day free trial is available for all editions, and the software also offers a 30-day money-back guarantee.
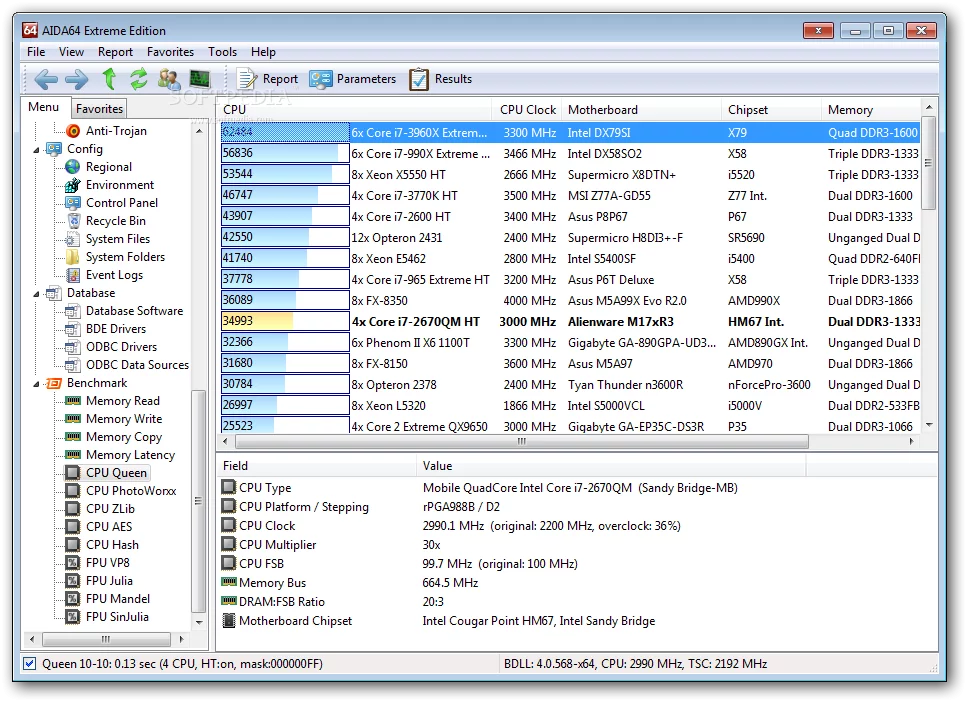
AIDA64 is a comprehensive diagnostic, benchmarking, and monitoring tool designed for Windows-based systems. It provides in-depth information about your system’s hardware, software, and network components, making it ideal for businesses and power users who need detailed insights into system performance and health. With its wide range of features, AIDA64 is suited for both hardware monitoring and IT asset management.
AIDA64’s diagnostic tools allow users to perform stress tests, run benchmarks, and monitor various system parameters like sensor readings, fan speeds, and temperature fluctuations. It also integrates with mobile devices for remote monitoring and provides detailed logs for uptime and downtime tracking.
Key Features:
- Sensor Monitoring and Logging: Monitors temperature, voltage, and fan speeds across all system components, providing real-time data.
- Alerting: Receive alerts when system parameters go out of range or if hardware failure is imminent.
- OSD Panel & Desktop Gadget: Displays critical system information directly on the screen via on-screen display (OSD) or a customizable desktop gadget.
- External LCD & VFD Support: Supports external displays, allowing you to view system stats on external LCD or VFD screens.
- Smartphone & Tablet Integration: Allows you to monitor system status on the go via mobile apps.
- Uptime & Downtime Statistics: Provides detailed statistics on system uptime and downtime, helping businesses track system reliability.
Editions:
- AIDA64 Extreme and AIDA64 Engineer: Primarily focused on diagnostics and benchmarking for power users and professionals.
- AIDA64 Business: Designed for IT asset management and system monitoring across multiple systems within a business.
- AIDA64 Network Audit: A solution for network inventory and management, allowing businesses to track network devices and software installations.
Verdict:
AIDA64 is a powerful tool that covers a wide range of hardware monitoring, diagnostics, and benchmarking needs. Whether you’re looking to monitor system health, perform stress tests, or manage IT assets, AIDA64 provides an all-in-one solution. Its various editions cater to different needs, from home users and small businesses to large enterprises, making it a versatile and valuable tool for any IT infrastructure.
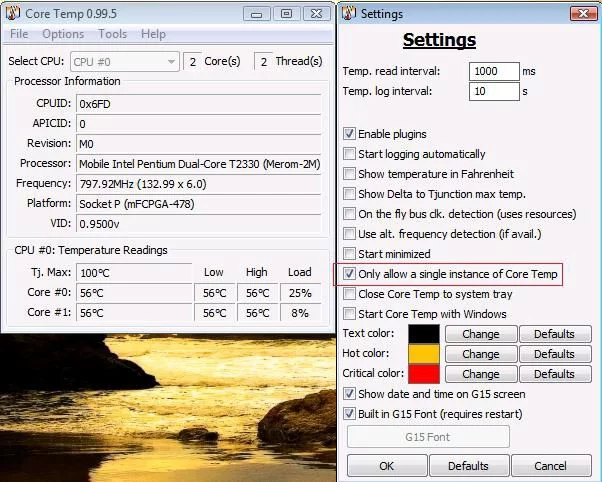
#8) Core Temp
Price:
Free
Core Temp is a lightweight, dedicated tool for monitoring the temperature of your computer’s processors. Unlike general monitoring software, Core Temp specifically focuses on providing temperature readings for individual processor cores, giving users an in-depth view of their CPU’s health. It supports Windows OS and can be a valuable tool for both casual users and system administrators who want to monitor and maintain optimal CPU temperatures.
Core Temp is known for its minimalist design and real-time monitoring capabilities, providing users with instant feedback on temperature fluctuations as workloads change. The software also includes a mobile app for Android and Windows Phone devices, enabling users to monitor their system temperature remotely.
Key Features:
- Core Temperature Monitoring: Displays the temperature of each individual core in the CPU, making it easy to track the performance of multi-core processors.
- Real-Time Temperature Fluctuations: Monitors and shows how CPU temperature changes with varying workloads and usage.
- Graphical View: Provides a graph view of temperature changes over time, helping users identify trends and potential overheating issues.
- Color-Coded Readings: Displays temperature readings with color-coding to quickly identify overheating or optimal temperature zones.
- Mobile App Support: The mobile app allows users to monitor their CPU temperature remotely on Android and Windows Phone devices.
Verdict:
Core Temp is an excellent, straightforward tool for users who want to focus on monitoring CPU temperatures. It is highly customizable and offers real-time insights into how your processor is performing under various conditions.
With its easy-to-read graphical display and mobile app support, Core Temp is ideal for users who want a simple, no-fuss monitoring tool for their CPU’s health. As a free tool, it’s a great choice for individuals and small businesses that don’t need complex monitoring systems but still want to keep track of their system’s core temperature.
Final Verdict on the Best Hardware Monitor Solutions
To wrap up, the best hardware monitor solutions are essential for maintaining the performance and longevity of computer systems. These tools offer real-time monitoring of vital components, such as CPU, GPU, RAM, and storage, to detect temperature fluctuations, voltage spikes, and usage patterns. By identifying and addressing issues before they become critical, these tools prevent system failures and ensure optimal performance.
For reliable hosting with constant performance monitoring, turn to Nestify. We provide scalable, secure, and high-performance hosting solutions with built-in hardware monitoring. Get started with Nestify Hosting today and power up your infrastructure!
FAQs on Top Hardware Monitoring Tools:
Can hardware monitoring tools prevent hardware failures?
While hardware monitoring tools cannot prevent hardware failures directly, they can help predict failures by tracking key metrics such as temperature, usage, and performance. Early warnings, such as excessive temperature or high load, allow you to take action before the hardware fails. For example, if the temperature of your CPU is too high, you can clean the fans or replace thermal paste before it causes a crash.
How do hardware monitoring tools send alerts?
Most hardware monitoring tools allow you to set thresholds for specific parameters (e.g., temperature, CPU usage) and will send alerts when those thresholds are exceeded. Alerts can be delivered via:
- Email notifications: Alerts sent to your inbox.
- SMS messages: Mobile notifications for immediate attention.
- Desktop pop-ups: On-screen messages or banners.
- Logging: Tools may log events for future reference
Are hardware monitoring tools only for businesses?
No, hardware monitoring tools are suitable for anyone who wants to monitor the health of their computer or network. While businesses often use these tools to manage complex IT infrastructures, home users can benefit as well by keeping track of their personal devices’ performance, especially in the case of overheating, high resource usage, or potential hardware failures.
Do I need a dedicated hardware monitoring tool if I already use an antivirus?
While antivirus software protects against malware and other cyber threats, it does not monitor the physical health of your hardware. Hardware monitoring tools track system performance and hardware status (such as temperature, voltage, and fan speed) in real-time.
For a complete system health check, it’s beneficial to use both antivirus software for security and a hardware monitoring tool for performance and hardware maintenance.
