
The digital industry allows the measurement of user behavior with tracking tools, which is incredible for the design process. With this data and the continuous improvement mindset, it is possible to postpone countless hours of analysis and react just in time based on the actual needs of the users.
Industrial and graphic design traditions have shaped the designer’s professional practice. Spending months studying a problem, designing prototypes, and testing solutions in controlled environments are standard in industries with design excellence.
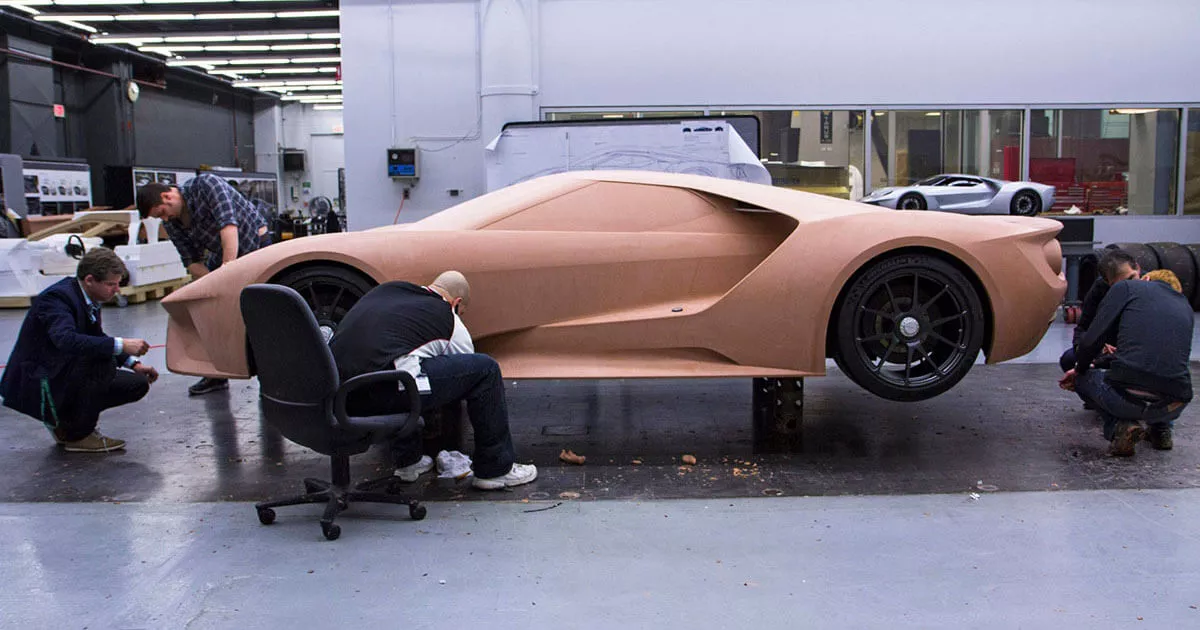
Design at Ford. A prototype of a Ford GT 2017. Design at Ford. Prototyping a Ford GT 2017
The agile cycle – build, measure, and learn – rescues the designer from this industrial tradition. In the agile environment, as a designer, I don’t have the months to do the research I would like, and the stakeholders expect me to answer specific questions. What to do? Measure and learn. To err in the first iterations is not only acceptable but also expected. Experiments and learning feedback on the design process turns trivial solutions into fantastic products!
It is important to stress that the need for research is eliminated even in this context. Only qualitative rationalization can clearly tell me what should be monitored and why it is necessary. I leave this subject for another time.
Lean UX and Validated Learning
Jeff Gothelf and Joshua Seiden compiled a method to integrate design and agile development in Lean UX. Under the Lean UX paradigm, the team involved in the solution is jointly responsible for product design. As a designer, I am not responsible for determining requirements but as a design process facilitator. Thus the knowledge is diluted, and, together, the team analyzes the problem and creates experiments (the MVPs) to validate hypotheses of the solution in production.
“Build MVPs that allow you to observe and measure what people do, not just what they say. In the design of digital products, behavior is more relevant than opinion”. Gothelff, Lean UX (2013) page 58.
Our team works with a cadence of usability tests and user interviews that feed us qualitative insights and avoid blatant usability issues. But with the product in production, how can we know if we are achieving the expected results?
“Site usage logs and analytics packages-especially analyzes-show how customers are using the site, where they are coming out, and how they are trying to manipulate the product to do the things they need or expect. Understanding of these reports provide real-world context for the decisions the team needs to make. Also use analytics tools to determine the success of experiments that are publicly released. How did the experiment change the use of the product? Are your efforts reaching the expected results? These tools provide an unbiased response. ” Gothelff, Lean UX (2013) page 88.
First experiments
When I started these studies, there was still no consolidated process of tracking and analyzing user behavior. To better explore the concept and present the possibilities to the team, I tested the hypothesis, “The main way to create a landing page is to duplicate a previous one.” Landing Pages are conversion pages that our clients use to convert visitors into qualified contacts, the Leads. The solution team relied heavily on this hypothesis since it recurred in qualitative analyses. To validate this hypothesis, I test how many users create new and how many create duplicate Landing Pages within a week.

The proportion of duplicate and created landing pages from scratch.
This fact rejected our hypothesis, which is excellent! We took another step toward the points. The problem persists: why does this qualitative data appear so often? I tested another hypothesis: “Duplicate Landing Pages are more published.” For this test, we’ll see how users behave in the funnel of creating these pages.

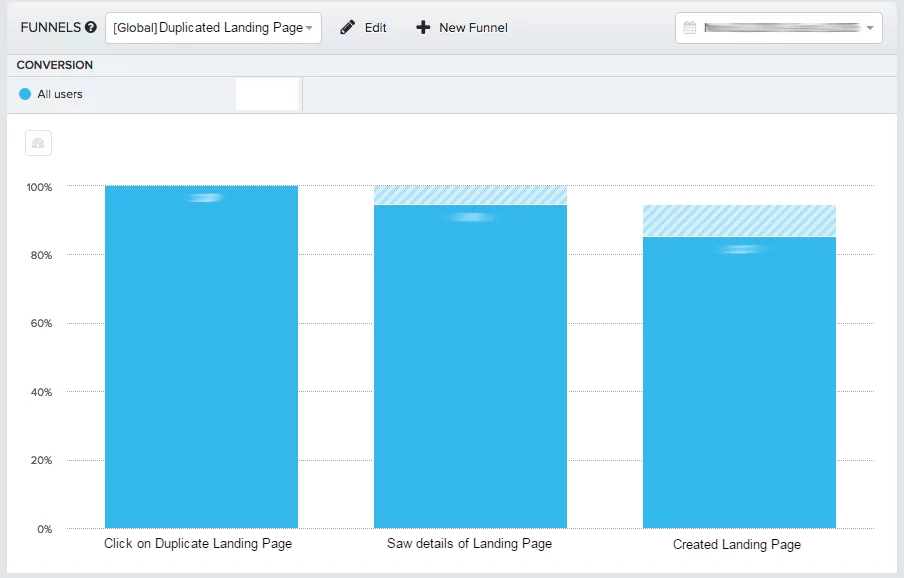
Even though, in absolute numbers, there are more Landing Pages created from scratch than duplicates, duplicates are, in fact, more published! With this data, we know that the abandonment of the funnel of creation of Landing Pages is enormous and that when a user duplicates a page, it will probably be published!
There are numerous user experience optimization opportunities hidden in this data. It is still possible to target users by personas, identify where and how users are abandoning the task, and so on. With this data, we come to know where our design actions are impacting.
Continuous process improvement
This initial effort went against an even greater effort by the product management team, culminating in the definition of KPIs to better measure the engagement of users.
Is that you? Have you worked with a quantitative analysis of usability and user behavior? We are very interested in exchanging ideas and good practices!
