
Key performance indicators (KPIs) should be used to guide business decisions. To achieve success in e-commerce, key performance indicators (KPIs) should be used as checkpoints. E-commerce business owners can track their sales, marketing, and customer service efforts with this data.
Your company’s specific objectives should guide your selection and tracking of key performance indicators. A few key performance indicators (KPIs) are useful for some objectives but not others. It is possible to think about a set of common performance indicators for ecommerce with the idea that KPIs should vary depending on the goal being measured.
Performance Indicators… What are they?

An indicator of performance is a measurable metric that can be compared to a target to assess progress toward that target. Some online stores may aim to increase their annual site traffic by a factor of 50 in the coming year.
One metric could be the unique daily visitors or the percentage of visitors from specific referral sites (paid advertising, search engine optimization, brand or display advertising, a YouTube video, etc.)
While there may be many possible performance indicators for a given goal, this can be overwhelming. As a result, it is common practice to focus on just a handful of KPIs most critical to achieving that goal. Key performance indicators (KPIs) are the metrics that most clearly and concisely reveal whether a company is progressing toward its objective.
Why do we care so much about KPIs?
- Empowering Decision-Making:
These insights empower eCommerce businesses to make informed decisions at every turn. By dissecting data from various KPIs such as customer acquisition cost (CAC), average order value (AOV), or conversion rates, businesses gain clarity on where to invest resources, which marketing channels to prioritize, and how to enhance customer experiences.
- Gaining a Competitive Edge:
The utilization of appropriate tools doesn’t just streamline operations; it elevates businesses above the competition. By extracting meaningful insights and acting upon them swiftly, eCommerce ventures position themselves advantageously in a crowded digital landscape.
- Thriving Amidst Dynamism:
In the ever-evolving digital sphere, adaptability is key. Data-driven insights, when utilized effectively through the right tools, foster agility. This agility allows businesses to respond promptly to market shifts, customer demands, and technological advancements, ensuring they remain relevant and competitive.
- Achieving Sustained Growth and Success:
By harnessing data-driven insights and employing the right technological aids, eCommerce ventures don’t just achieve short-term success; they set the stage for sustained growth. This strategic approach builds the foundation for enduring success, enabling businesses to adapt, evolve, and consistently thrive in the dynamic digital ecosystem.
What is the comparison between SLA and a KPI?
An SLA is a service level agreement, while a KPI indicates performance. In e-commerce, a service level agreement (SLA) defines the partnership parameters between a retailer and a supplier. You may have an SLA with your supplier or your digital marketing firm. We all know that a key performance indicator (KPI) is an operational metric. Key performance indicators are typically measurable, but they can also be qualitative.
Characteristics of Various KPIs
A wide variety of KPIs exist. They can reveal the past, foretell the future, or be of either type. Key performance indicators (KPIs) also encompass many aspects of daily business life. Most key performance indicators (KPIs) in the field of e-commerce can be placed into one of the following five classes:
- Sales
- Marketing
- Service to Manufacturers’ Clientele
- Management of Projects
Tips for Choosing the Right Key Performance Indicators in Online Shopping

There are many KPIs to track, but not all of them are essential to the growth of your e-commerce company. Therefore, here are some things to consider when picking eCommerce KPIs:
- Business objectives: Pick key performance indicators (KPIs) that will help you achieve your business goals and improve your bottom line (i.e., net income/net profit).
- Simple metrics to track KPIs: Pick Key Performance Indicators (KPIs) that can be easily measured and will give you (and your team) actionable insight into how your business is performing.
- Your company’s expansion phase: Pick Key Performance Indicators appropriate for the current phase of your company’s development. If your eCommerce company is in the early stages of its lifecycle, certain key performance indicators (KPIs) will be more important than others.
- Reality-based key performance indicators: Each eCommerce company has unique key performance indicators (KPIs), so it’s vital to pick metrics that are most relevant to your company rather than following industry or competitor trends.
- Always be concise and to the point: In this case, less is more. There’s no point in keeping track of a mountain of (useless and irrelevant) key performance indicators (KPIs). The best key performance indicators (KPIs) for your business should help you gain insights you can use immediately (and your team).
Top Key Performance Indicators
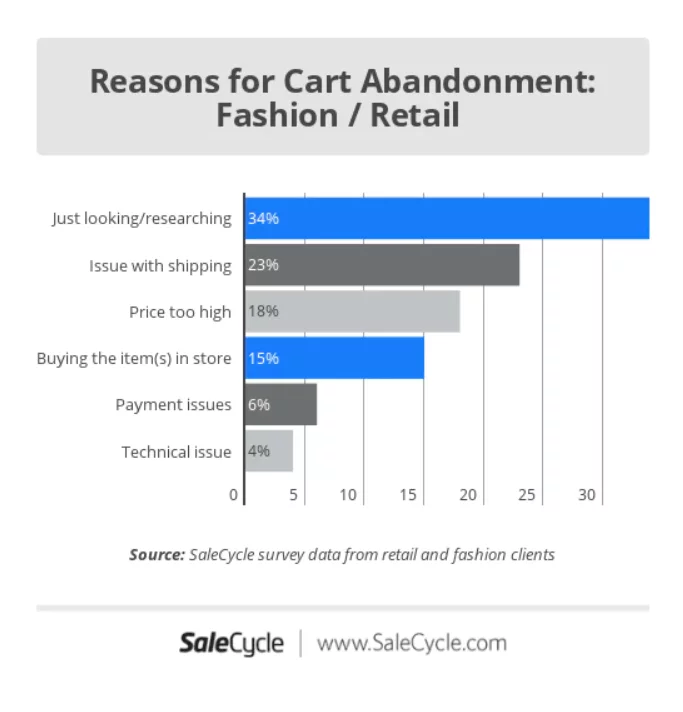
1. Abandonment of shopping cart percentage

In online shopping, a recurring setback known as “cart abandonment” plagues many eCommerce ventures. This phenomenon occurs when a customer diligently adds items to their virtual cart but then abruptly exits the site without finalizing the purchase—a frustrating and unfortunately common occurrence.
Picture the exhaustive efforts invested up to the crucial checkout juncture, only to witness a potential customer retreat moments before sealing the deal. Consider the energy devoted to crafting compelling offers, attracting attention, nurturing relationships, and steering customers to the brink of purchase, only for them to abandon their carts at the eleventh hour. Regrettably, this scenario is all too familiar in the eCommerce landscape.
According to findings from the Baymard Institute, an astounding 70% of prospective online shoppers abandon their carts post-item selection. These abandoned carts represent missed opportunities and diverse reasons for customers leaving their carts deserted.
Various factors contribute to this unsettling trend—ranging from visitors needing more time to deliberate on their purchase to encountering deterrents like unexpectedly high shipping costs, website glitches, convoluted checkout procedures, payment rejections, and an array of other impediments. The culmination of these issues manifests as abandoned carts, stalling what could have been successful transactions.
Addressing cart abandonment often involves leveraging specialized tools and plugins to streamline the shopping experience and mitigate these obstacles:
- Exit-Intent Popups: Tools like OptinMonster (optinmonster.com) help capture leaving visitors by displaying targeted offers or incentives just as they are about to leave, enticing them to reconsider.
- Abandoned Cart Recovery Plugins: Platforms like Shopify offer plugins such as ‘Abandoned Cart Recovery’ (apps.shopify.com/abandonment-protector) that automatically send reminder emails to customers who abandoned their carts, nudging them back to complete their purchase.
- Checkout Optimization Tools: Solutions like WooCommerce’s ‘One Page Checkout’ extension (woocommerce.com/products/one-page-checkout/) or Magento’s ‘Checkout Suite’ optimize the checkout process, simplifying steps and reducing friction, thereby decreasing the chances of abandonment.
- Shipping Cost Calculators: Integrating shipping cost calculators like Shippo (goshippo.com) allows customers to estimate shipping costs upfront, minimizing surprises and potential cart abandonment at the final stage.
To determine the shopping cart abandonment rate, divide the number of completed purchases by the total number of shopping carts created. Subtract one from your number, then multiply it by 100 to get the percentage rate:
One minus (Sales Volume / New Shopping Carts) x 100 = Cart Abandonment Rate
The shopping cart abandonment rate is defined as the percentage of visitors who leave without purchasing after filling out a shopping cart.
1 – (50 ÷ 250) x 100 = 80%
2. Conversion Rate
Understanding the effectiveness of your sales pitches and calls-to-action (CTAs) goes beyond aesthetics; it’s about their ability to drive conversions and boost sales. The conversion rate of your website stands as a litmus test for the success of these elements.
Your website’s conversion rate signifies the percentage of visitors who take a desired action while browsing. This action can range from signing up for a newsletter to making a purchase. It’s the pivotal metric that reflects how effectively your website motivates visitors to act.
A high volume of traffic to a landing page might seem promising, but if the conversion rate remains dismal, it’s a red flag. It indicates that despite attracting visitors, your website might not be persuading them to take the desired actions. In such cases, experimentation becomes crucial to bolster these conversion rates.
Globally, a 2% conversion rate is often considered typical for online shoppers. However, striving for improvement beyond this benchmark is a common goal for businesses aiming to maximize their sales potential.
Calculation of Conversion Rate:
Calculating the conversion rate involves a simple formula. For instance, if you attract 1,000 visitors to your website and 50 of them make a purchase, your conversion rate would be 5%.
Conversion Rate = (Number of Conversions / Total Visitors) * 100
In this scenario, with 50 sales divided by 1,000 visitors multiplied by 100, your conversion rate stands at 5%.
Tools and Plugins for Enhancing Conversion Rates:
Improving conversion rates often involves leveraging specific tools and plugins designed to optimize sales funnels and enhance CTAs:
- CTA Optimization Tools: Platforms like OptinMonster (optinmonster.com) offer tools to create and optimize CTAs, increasing their effectiveness in driving conversions.
- A/B Testing Plugins: Tools such as Google Optimize (optimize.google.com) or Visual Website Optimizer (VWO) (vwo.com) enable A/B testing, allowing you to experiment with different elements and strategies to identify what drives higher conversion rates.
- Sales Funnel Analytics: Platforms like Kissmetrics (kissmetrics.com) or Mixpanel (mixpanel.com) provide in-depth analytics to understand user behavior within your sales funnel, enabling targeted optimizations for higher conversions.
3. Customer acquisition cost (CAC)

The Customer Acquisition Cost (CAC) represents the expense a company incurs to acquire a new customer. This metric is derived by dividing the total cost of sales and marketing efforts within a specific period by the number of customers acquired in that same duration.
For instance, if $1,000 is invested in advertising and marketing, resulting in 25 new clients, the CAC would be $40 per customer (CAC = Total Marketing Expenses / Number of New Customers).
Understanding CAC is crucial, especially when considering products with diverse price points. For instance:
- In a business selling industrial machinery with a $4,000 average order value, a $100 CAC seems highly efficient, ensuring profitable customer acquisition.
- Contrastingly, for a business selling $80 backpacks, a $100 CAC would likely lead to unprofitable customer acquisition, necessitating drastic reductions in CAC to maintain profitability.
CAC insights help in allocating marketing budgets for achieving targeted customer acquisition over specific periods. By understanding CAC, businesses can make informed decisions about the portion of their budget to allocate to customer acquisition.
An essential aspect of CAC is its impact on profits. An increase in marketing spending often leads to increased sales, but if the CAC rises in parallel, the elevated sales might result in lower profits. Thus, understanding and controlling CAC are vital to sustaining a healthy bottom line.
Tools and Plugins for Calculating and Optimizing CAC:
- Analytics Platforms: Google Analytics (analytics.google.com) provides insights into marketing expenditures and customer acquisition data, aiding in CAC calculations.
- CRM Tools: Customer Relationship Management tools like HubSpot (hubspot.com) or Salesforce (salesforce.com) assist in tracking customer acquisition costs by attributing sales and marketing efforts to customer acquisition.
- Marketing Attribution Tools: Tools such as Bizible (bizible.com) or Ruler Analytics (ruleranalytics.com) help in attributing revenue to specific marketing channels, enabling a more accurate calculation of CAC.
4. Average order value (AOV)
AOV is a crucial metric in online retail, representing the average amount of money customers typically spend per transaction. Elevating the AOV presents a straightforward method to bolster earnings.
Increasing the revenue per customer transaction also allows for more flexibility in marketing expenditures while still maintaining profitability. Calculating AOV involves dividing the total revenue generated within a specific period by the total number of orders received in that duration.
Calculation of Average Order Value (AOV):
The formula for AOV is straightforward: AOV = Total Revenue / Number of Orders Placed. For instance, if a business made $10,000 from 120 sales in a month, the AOV would be $83.33 ($10,000 / 120).
5. Customer lifetime value (CLV)

Customer Lifetime Value (CLV or LTV) is pivotal for understanding the worth of a customer to a company throughout their engagement. Determining this value might be complex, but it’s indispensable for strategic planning and ROI assessment.
CLV, also known as Customer Lifetime Value or Lifetime Value (LTV), quantifies the anticipated net profit from a customer over their relationship with a company. Assigning a monetary value to each customer serves as a compass for future planning and aids in ROI calculations.
Calculation of Customer Lifetime Value (CLV):
CLV can be computed by multiplying the Average Order Value (AOV) by the Average Purchase Frequency and then further by the Average Customer Retention Time. The formula stands as follows:
CLV = AOV x Average Purchase Frequency x Average Customer Retention Time
Tools and Plugins for Analyzing CLV:
- CRM Platforms: Customer Relationship Management tools such as HubSpot (hubspot.com) or Salesforce (salesforce.com) assist in tracking customer interactions and purchase history, which is pivotal for accurate CLV calculations.
- Predictive Analytics Tools: Platforms like Google Analytics (analytics.google.com) or Kissmetrics (kissmetrics.com) offer predictive analytics features that aid in forecasting customer behavior and determining future purchase patterns, essential for refining CLV estimations.
- Customer Segmentation Tools: Utilizing platforms like Mixpanel (mixpanel.com) enables detailed customer segmentation, allowing for a more nuanced understanding of different customer groups and their corresponding CLV.
6. Net Profit Margin

When running a business, there is a lot to think about, including developing products, promoting those products, recruiting employees, and providing quality customer service. However, one thing must always be kept in mind: Profit.
There can be no definition of “business” apart from the generation of profits. The money you make from selling something is called “revenue.” Subtracting expenses will leave us with a profit.
The percentage by which your profits exceed your revenues is known as your “net profit margin,” representing the total amount of money you make.
To illustrate, let’s say you spend $100 on bike parts. The next step is constructing a unique bicycle and offering it for $250. This results in a $150 profit, or a 60% margin.
If you want to know how well your company is doing, look at its net profit margin. Now, a healthy net margin is something to marvel at. A high net profit margin means you’ll have plenty of cash to put back into the company. However, a low net profit margin will hamper the company’s ability to bring in money and slow its expansion. You’ll need three pieces of information to determine your net profit margin:
How much money was made from sales as a whole? Total business expenses include production, advertising, running the business, paying employees, etc. Paying the government a portion of your earnings. Let’s start by figuring out your return. Subtract the cost of goods sold from your total revenue for the period in question.
Revenue minus expenses equals net profit.
The net profit margin is determined by multiplying one hundred times the net profit ratio by total revenue.
7. Return Rate:

Keeping a watchful eye on return rates is more than just assessing product quality and customer satisfaction; it’s about ensuring the brand’s integrity and fostering loyalty. Major eCommerce platforms like Magento, Shopify, or WooCommerce are not only equipped with robust internal tracking systems but also integrate seamlessly with third-party analytics tools. For example:
- Google Analytics: Within its expansive suite, the ‘Ecommerce’ segment meticulously dissects product returns, providing a wealth of information on return rates, reasons behind returns, and trends over time. This not only helps in identifying problematic products but also aids in understanding customer behavior.
- WooCommerce Extensions: Purpose-built plugins like ‘Advanced Refund System’ or ‘RMA for WooCommerce’ streamline the entire return process, offering a frictionless experience for customers initiating returns while providing administrators with comprehensive analytics on returned items, facilitating proactive measures to rectify issues.
8. Traffic Sources and Conversion by Channel:

Understanding the intricate pathways through which customers find and engage with an online store is the cornerstone of effective marketing strategies. Advanced tracking tools integrated into eCommerce platforms or via specialized plugins provide invaluable insights:
- Google Analytics: Its ‘Acquisition’ section functions as a treasure trove of data, offering comprehensive reports on the origins of traffic, detailing various sources (organic, paid, social, etc.), and their corresponding conversion rates. This information is gold for refining marketing efforts and allocating resources judiciously.
- Tailored Plugins: For instance, ‘Google Channel’ or ‘Traffic Booster’ seamlessly sync with Google Analytics and the specific eCommerce platform, offering an in-depth analysis of traffic sources and conversion rates. These plugins often provide actionable insights, empowering businesses to optimize their marketing strategies for maximum impact.
9. Inventory Turnover Rate:

Efficiently managing inventory is the linchpin of operational success. The ability to swiftly move inventory while avoiding overstocking or stockouts requires meticulous monitoring and optimization. Specialized tools and plugins cater to this need:
- Inventory Management Tools: Platforms like TradeGecko or Zoho Inventory offer sophisticated features for tracking inventory turnover rates in eCommerce businesses. These tools provide actionable insights into sales velocity, inventory turnover ratios, and trends. They enable businesses to fine-tune their inventory management strategies for optimized stock levels and improved efficiency.
- eCommerce Platform Plugins: Tailored plugins such as ‘WooCommerce Stock Manager’ or ‘TradeGecko for Magento’ seamlessly integrate with eCommerce platforms, streamlining inventory management tasks. These plugins not only simplify inventory tracking within the platform but also offer detailed insights into turnover rates. By leveraging these purpose-built plugins, businesses gain a deeper understanding of their inventory turnover metrics and can make informed decisions to enhance their inventory management processes.
10. Customer Satisfaction and Reviews:

The heartbeat of any successful eCommerce venture lies in understanding customer sentiment and harnessing the power of reviews. Tools and plugins dedicated to gathering and interpreting customer feedback play a pivotal role:
- Survey Tools: Cutting-edge platforms like SurveyMonkey or Typeform empower businesses to craft sophisticated customer satisfaction surveys, gathering nuanced feedback that can steer future strategies.
- Review Plugins: eCommerce platforms host plugins such as ‘Yotpo‘ for Shopify or ‘Judge.me’ for WooCommerce. These plugins actively encourage customers to leave reviews and provide detailed insights into satisfaction levels, aiding in identifying areas of improvement and amplifying positive experiences.
11. Mobile Performance Metrics:

In an era where mobile commerce continues to soar, optimizing the mobile shopping experience is non-negotiable. Tools and plugins catering to mobile-specific metrics are indispensable:
- Mobile Analytics Tools: Sophisticated platforms such as App Annie or Mixpanel delve deep into mobile-specific metrics, offering comprehensive insights ranging from bounce rates and session durations to conversion rates. These insights play a critical role in tailoring the mobile experience to meet user expectations, ultimately enhancing user engagement and satisfaction.
- eCommerce Platform Mobile Optimizations: Tailored plugins like ‘Mobile Converter’ for Magento or ‘Mobile Assistant Connector’ for WooCommerce are specifically designed to elevate mobile performance within eCommerce platforms. These plugins provide detailed insights into mobile-specific sales and conversion rates, offering actionable data that empowers businesses to refine and optimize the mobile shopping journey. By utilizing these purpose-built plugins, eCommerce ventures can enhance the mobile experience for users, resulting in increased conversions and improved user satisfaction.
Conclusion:
These strategic approaches aren’t just about keeping pace; they are about setting a precedent. It enables eCommerce ventures to be at the forefront of innovation, responsiveness, and customer-centricity, leading to sustained growth and success that transcends market fluctuations and digital disruptions. It’s the fusion of insightful data interpretation and innovative tool utilization that propels businesses from mere survival to enduring triumph in the ever-evolving digital sphere.
FAQs on Ecommerce KPIs:
What does it mean to have a leading indicator instead of a lagging indicator?
Leading indicators are metrics that help ensure businesses remain on track to meet their long-term goals. For online stores, these metrics provide early signals of success, such as the percentage of customers who buy related items. In contrast, lagging indicators evaluate past output and efficiency. They are simple to track but difficult to alter, making them ideal for gauging the success of current initiatives.
To what extent do non-financial and financial key performance indicators vary?
Key financial metrics are those derived from the elements of a company’s balance sheet and income statement. These key performance indicators assess how efficiently a business operates its resources to maintain steady operating profits.
Another metric used to evaluate a company’s performance is the non-financial key performance indicator. Employee and customer happiness, product quality, operational efficiency, and the company’s pipeline are common non-financial KPIs.
Which key performance indicators (KPIs) should an online store use?
- Rate of shopping cart abandonment
- Success in changing over
- Acquisition price per new customer
- Lifetime value of a customer
- Value of a typical order
- Profit margin after taxes
