
In the fast-paced world of customer service, businesses rely on contact centers as the frontline for engaging with clients, resolving issues, and building lasting relationships. However, managing a contact center efficiently requires more than just answering calls and responding to emails—it demands actionable insights and real-time data to drive informed decision-making.
What is a Contact Center Dashboard?
A contact center dashboard serves as a comprehensive visual reporting tool, offering real-time insights into crucial contact center metrics and key performance indicators (KPIs). By aggregating data from various contact center channels, it provides a centralized view of customer interactions, agent performance, and operational trends.
Visual elements such as bar charts, line charts, pie charts, and gauges present data points, enabling C-suite executives and managers to make informed decisions swiftly. Here are the key benefits of using a contact center dashboard:
- Real-time decision-making: With real-time insights, contact center dashboards empower leaders to respond promptly to peak periods, optimizing workforce management and improving overall responsiveness.
- Enhanced visibility: Dashboards offer a comprehensive view of critical contact center KPIs, providing executives and managers unparalleled visibility into operations and agent performance. Integration with CRM systems allows for a real-time view of customer interactions and journeys.
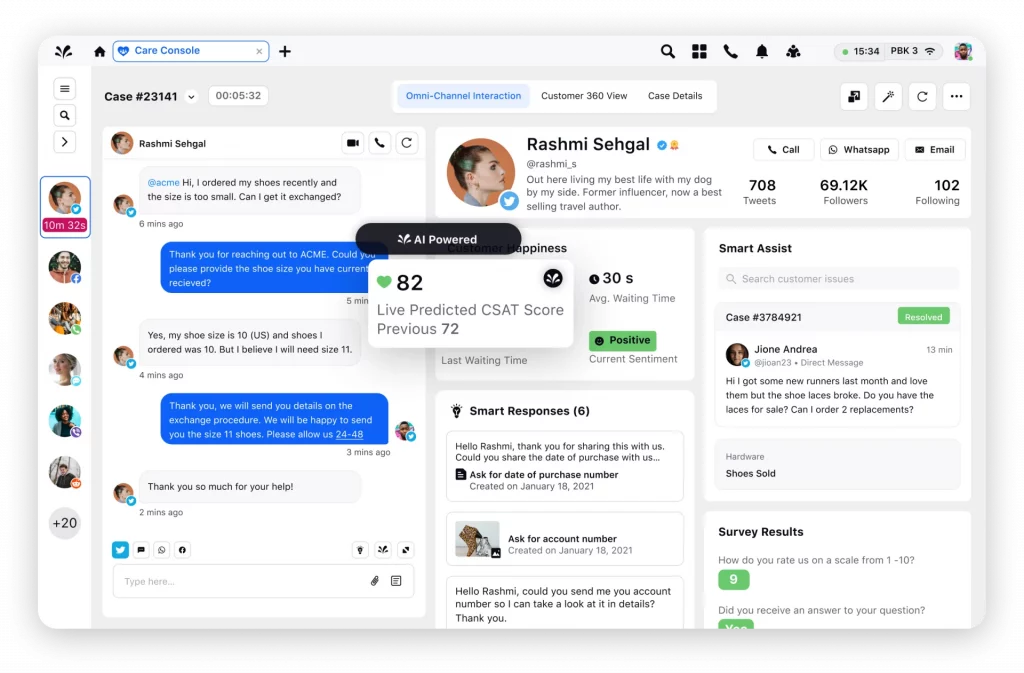
- Improved customer experience: Monitoring customer feedback and sentiment in real time enables swift identification of pain points, fostering customer empathy, and facilitating on-the-fly changes to enhance the overall customer experience.
- Optimized agent performance: Granular monitoring of agent performance metrics supports targeted coaching, training, and workflow adjustments, enhancing efficiency and customer interactions.
- Strategic planning: Historical and trend data presented in dashboards aid in strategic planning, enabling the identification of patterns, forecasting future demands, and delivering proactive customer service at scale.
- Resource allocation efficiency: Insights into agent utilization and workload distribution facilitate more efficient allocation of human and technological resources, ensuring the right resources are deployed at the right time.
- Proactive issue resolution: Early detection of emerging issues allows for proactive resolution, minimizing the impact on operations and customer satisfaction.
Types of Contact Center Dashboards:
1. Operational dashboards
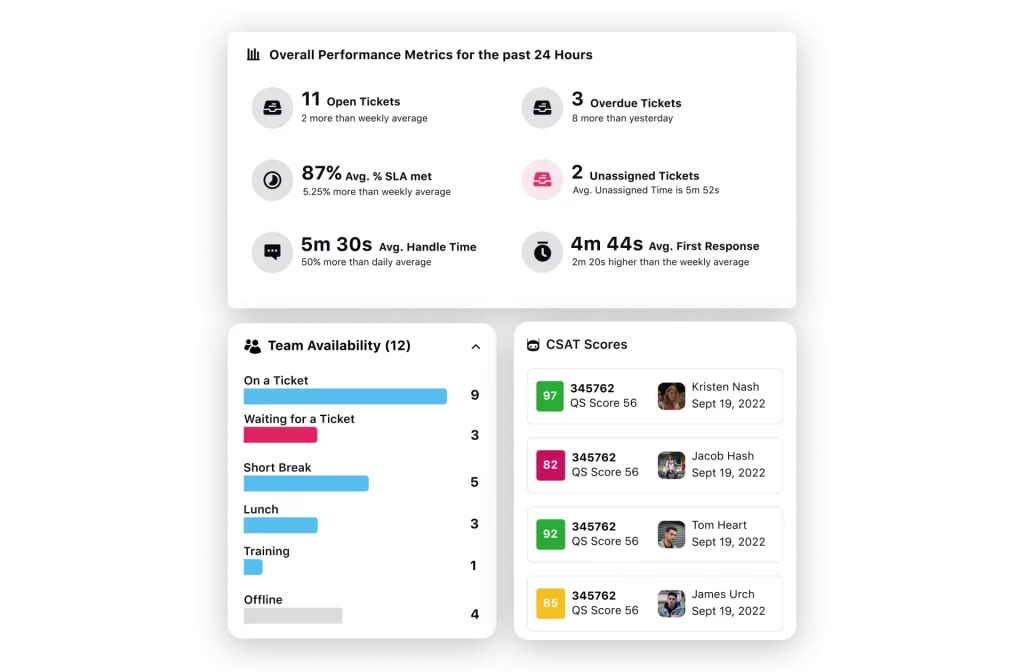
Focus: Operational dashboards serve as real-time monitoring tools, offering insights into the day-to-day activities of a contact center.
Key metrics covered: These dashboards track critical metrics such as call volume, average hold time, call abandonment rate, average speed of answer, escalation rates, service level adherence, and current queue status, among others.
Purpose: The primary purpose of operational dashboards is to enable quick decision-making and efficient management of daily contact center operations. By providing real-time visibility into key metrics, these dashboards empower supervisors and team leaders to address issues promptly and ensure smooth operation of the contact center.
2. Agent performance dashboards
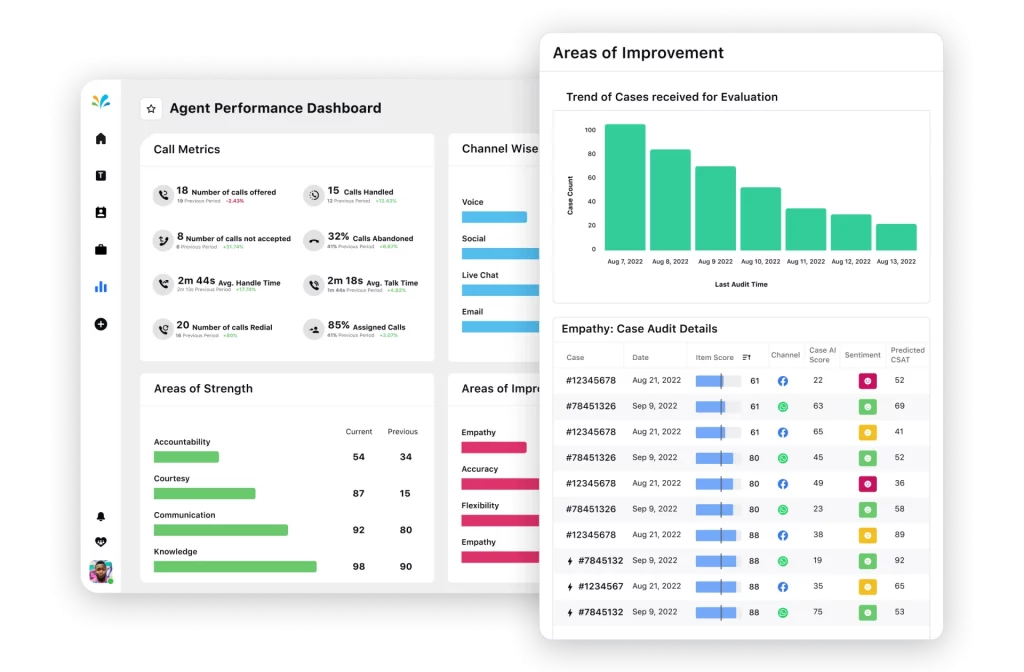
Focus: Agent performance dashboards are tailored to monitor and analyze the performance of individual agents and teams.
Key metrics covered: These dashboards typically include KPIs such as Average Handle Time (AHT), First Contact Resolution (FCR), Customer Satisfaction (CSAT) scores, quality scores, call wrap-up time, transfer rates, and knowledge base utilization.
Purpose: The purpose of agent performance dashboards is to enable supervisors and managers to assess agent performance trends and identify areas for improvement. By tracking key metrics, these dashboards facilitate targeted coaching and training interventions to enhance agent productivity and customer satisfaction.
3. Strategic dashboards
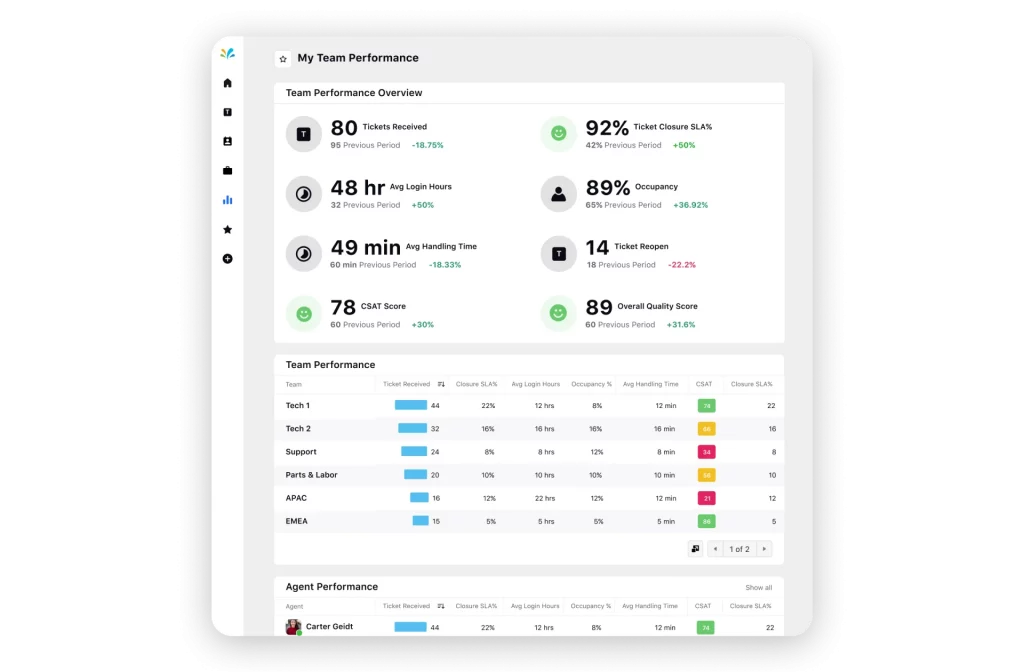
Focus: Strategic dashboards provide insights into long-term goals and trends within the contact center, supporting strategic decision-making.
Key metrics covered: Strategic dashboards may include metrics such as CSAT score, Net Promoter Score (NPS), workforce utilization, agent productivity, customer retention rate, forecast accuracy, and other key performance indicators relevant to the organization’s strategic objectives.
Purpose: The purpose of strategic dashboards is to offer a comprehensive view of the contact center’s performance and trajectory over time. By analyzing trends and forecasting future outcomes, these dashboards enable contact center leaders to make informed strategic decisions and prioritize initiatives aimed at improving overall performance and customer satisfaction.
4. Customer experience (CX) dashboards
Focus: CX dashboards prioritize metrics related to customer satisfaction and overall experience.
Key metrics covered: These dashboards typically include response time, resolution time, CSAT score, Customer Effort Score (CES), Net Promoter Score (NPS), and sentiment analysis of customer feedback.
Purpose: The primary purpose of CX dashboards is to provide insights into the customer’s perspective, identify pain points, and drive data-driven decisions aimed at enhancing the overall customer experience.
5. Agent productivity dashboards
Focus: Agent productivity dashboards center around metrics related to agent efficiency and workload management.
Key metrics covered: Occupancy rate, script adherence, task completion rate, and other metrics that help optimize agent workload and resource allocation.
Purpose: These dashboards play a vital role in ensuring that agents work efficiently and meet performance targets, thereby contributing to improved customer service delivery.
6. Financial dashboards
Focus: Financial dashboards offer insights into the financial performance of the contact center.
Key metrics covered: Operational costs, revenue generated from interactions, cost per interaction, and other financial metrics relevant to contact center operations.
Purpose: The purpose of financial dashboards is to assess the financial impact of contact center activities and optimize processes to maximize return on investment (ROI).
7. Multichannel dashboards
Focus: Multichannel dashboards track performance metrics across various communication channels utilized by the contact center.
Key channels covered: Voice calls, email, live chat, social media, and any other communication channels used for customer interactions.
Purpose: These dashboards enable contact center managers to monitor and optimize performance across diverse channels, ensuring a seamless and consistent customer experience regardless of the channel used for communication.
8. Self-service dashboards
Focus: Self-service dashboards center around metrics related to customer engagement with self-service options.
Key metrics covered: Metrics such as self-service utilization rate, resolution rates, user completion rate, and self-service containment rate are included in these dashboards.
Purpose: The primary purpose of self-service dashboards is to assess the effectiveness of self-service options, identify areas for improvement, and enhance the overall customer experience by providing convenient and efficient self-service solutions.
9. Quality and compliance dashboards

Focus: Quality and compliance dashboards prioritize adherence to regulatory and internal compliance standards.
Key metrics covered: Metrics related to internal policies and compliance, including SLA adherence, quality scores, error rates in compliance documentation, documentation accuracy, and audit results, are featured in these dashboards.
Purpose: These dashboards ensure that contact center operations comply with legal and organizational requirements, minimizing the risk of non-compliance and maintaining high-quality interactions with customers.
10. Campaign dashboards
Focus: Campaign dashboards focus on tracking metrics specific to marketing or outreach campaigns.
Key metrics covered: Metrics such as customer responses, click-through rates, conversion rates, and cost per conversion are tracked in campaign dashboards.
Purpose: The purpose of campaign dashboards is to evaluate the performance of targeted campaigns, refine marketing strategies, and optimize marketing initiatives to achieve better results and maximize return on investment (ROI).
Top Contact Center Dashboard Trends to Watch Out for in 2024
In the ever-evolving landscape of customer interactions, staying updated with the latest trends is crucial for contact center managers to ensure that their dashboards remain effective and aligned with evolving business objectives. Let’s explore some of the emerging trends shaping the evolution of contact center dashboards in recent years.
- Unified view
One of the prominent trends is the provision of a unified view within contact center dashboards. This integration aggregates data from various sources such as call logs, ticketing systems, and customer feedback, offering a comprehensive overview of the contact center’s performance. By providing a holistic picture, these dashboards enhance decision-making capabilities and deepen understanding.
- Automation and quick action
The integration of contact center AI and automation into dashboards is gaining traction. These dashboards showcase AI-driven analytics and predictions, enabling contact centers to improve operational efficiency. For example, agents can create shortcut buttons for frequently escalated issues, streamlining processes and reducing manual effort.
- Logical presentation of data and metrics
Advanced contact center dashboards adopt a logical presentation of data, grouping related elements such as agent performance, job satisfaction, and training needs. This organized structure facilitates supervisors in quickly assessing each agent’s performance and growth trajectory.
- Data drill-down capabilities
Contact center dashboards now offer data drill-down capabilities, allowing users to delve into specific datasets for deeper insights. This feature enables users to analyze resolution times for individual agents or specific ticket types, empowering informed decision-making.
- Customization and personalization
Modern dashboards prioritize customization, enabling users to tailor the interface according to their unique requirements. For instance, agents can choose to display customer information alongside incoming inquiries, providing a comprehensive view of customer history and preferences.
- Real-time widgets
Today’s contact center dashboards incorporate real-time widgets that display dynamic metrics such as incoming call volumes, average call duration, and email backlog. Agents can select relevant metrics for their roles and arrange them for quick visibility, while supervisors can access consolidated views of team performance metrics for resource allocation decisions.
- Cloud compatibility
The adoption of cloud compatibility is on the rise as contact centers transition towards cloud-based solutions. Designed specifically for cloud environments, these dashboards offer enhanced flexibility, scalability, and simplified management. Cloud compatibility facilitates streamlined updates and enhancements, ensuring rapid deployment of new features without causing disruptions to operations.
Conclusion:
In summary, contact center dashboards continue to evolve to meet the demands of modern customer service operations, incorporating advanced features such as unified views, automation, logical data presentation, drill-down capabilities, customization, real-time widgets, and cloud compatibility to drive efficiency and effectiveness.
